Overview: Building a Vflo™ model
In Vflo™, the BOP file is the basin model. Building a basin model and saving it as a basin overland properties, or BOP file (*.bopx, *.bop) is the first step in using Vflo™. The BOP file stores the essential data that makes up a Vflo™ model: information on the model domain, drainage network, channel and reservoir locations, and model parameters such as roughness and hydraulic conductivity, as well as shapefiles. BOP files also store information entered in the Vflo™ model after initial model development, such as: metadata, the location of watch points, calibration factors, and other additional data.
There are four key options for developing a basin model:
- 1. AutoBOP may be used to develop a drainage network, establish the Vflo™ domain, and import parameter maps.
- A high resolution DEM is required.
- Key shapefiles, such as channel and basin boundary shapefiles, are recommended, as well as parameter maps developed in GIS.
- Data uploaded to AutoBOP is automatically reprojected to a target coordinate system, reducing GIS pre-processing.
- 2. A basin model may be manually developed within Vflo™; GIS is not required.
- Flow direction arrows are drawn in.
- Hydraulics and Infiltration panels are used to designate model parameters such as roughness and hydraulic conductivity.
- 3. GIS software may be used to develop parameter maps for import to Vflo™.
- A high resolution digital elevation model (DEM), gridded soil maps, gridded land use maps, and other GIS data are required for this method.
- 4. A custom-prepared BOP file for the modeled region may be used.
- Contact Vieux and Associates, Inc. for ordering details.
Contents
Opening an existing Vflo™ model
If a basin model has been previously prepared as a BOP file, then loading the model is as simple as loading a BOP file. Depending on the domain size, the number of associated shapefiles, and the computer hardware used, loading may take a few seconds to several minutes to complete.
Step-by-step instructions
1.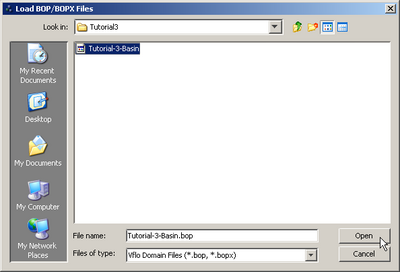 Select File | Open and navigate to the desired BOP file. Select OK.
- Alternative methods: Use the shortcut key CTRL+O, or select the Open
 tool from the Vflo™ Toolbar.
- Alternative methods: Use the shortcut key CTRL+O, or select the Open
Developing a Vflo™ model using AutoBOP
The files used in this section are available online: AutoBOP Workshop Files (.zip)
Step-by-step instructions
Opening AutoBOP
1. Select File | New.
- Alternately, use the Create a new file
 tool, or press CTRL + N.
2. In the Domain Wizard window, select Create Domain using AutoBOP.
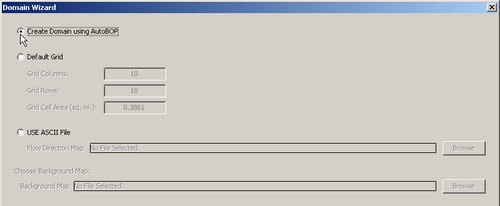
3. If a Vflo™ model is currently open, a dialog will ask, "Would you like to save the current basin?"
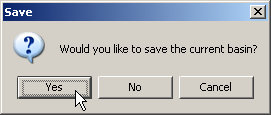
- Choose Yes or No. Choosing Cancel will cancel the process of creating a new domain and return to the Vflo™ interface.
Selecting a DEM and shapefiles
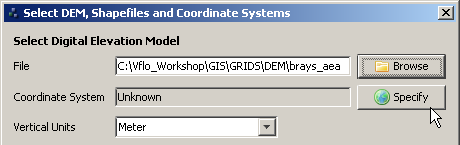
1. Select a DEM file.
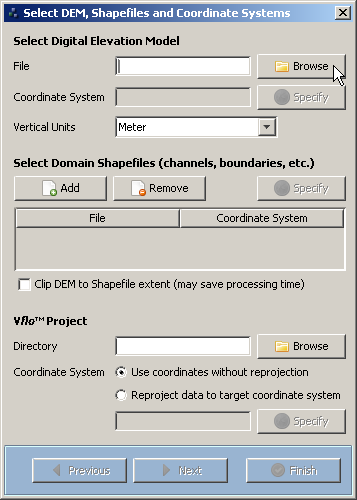
- The Select DEM, Shapefiles and Coordinate Systems dialog allows the user to load a DEM and key shapefiles, to choose a Vflo™ Project directory, and to reproject data to a single target coordinate system. First, click the
 Browse button at the top right of the dialog to load the Digital Elevation Model (DEM). In the Choose DEM dialog, browse to the desired DEM directory and click Open. To be loaded, DEM files must be in ADF (ESRI Arc/Info Data File) or ASCII (ESRI ASCII GRID File) format.
2. Specify the DEM coordinate system.
- This step is optional if the DEM and all shapefiles are established in the same coordinate system. In this case, bypass the DEM Coordinate System field, and select the Use coordinates without reprojection option at the bottom of the dialog.
- If loaded files are established in different projections, however, specifying the coordinate system of the DEM is required. Designating a DEM coordinate system allows data to be re-sampled and reprojected to a single, target coordinate system. To select a DEM coordinate system, click the
 Specify button as shown above.
- Within the Choose DEM Coordinate System dialog (shown below), there are three options:
- A. Import from loaded data:
- If a DEM or shapefile has been loaded from a directory containing ESRI Projection (PRJ)/Well Known Text (WKT) files (file extension *.prj), then that DEM/shapefile will appear in the Import from loaded data list. To select the coordinate system of one of these files as the coordinate system of the DEM, select the Import from loaded data option and click on the file name.
- A. Import from loaded data:
- B. Load from file:
- Use this option to designate the DEM coordinate system by loading a PRJ/WKT (*.prj) file directly. Select Load from file, then click the Browse button. In the Choose PRJ File dialog, browse to the desired file, then click Open.
- Use this option to designate the DEM coordinate system by loading a PRJ/WKT (*.prj) file directly. Select Load from file, then click the
- B. Load from file:
- C. Choose from list:
- If the coordinate system is included in the AutoBOP list shown, select the Choose from list option and click on the coordinate system name. Type keywords into the Filter field to assist coordinate system identification.
- C. Choose from list:
- In the example shown below, the Load from file option has been used to load the coordinate system from a PRJ file (*.prj).
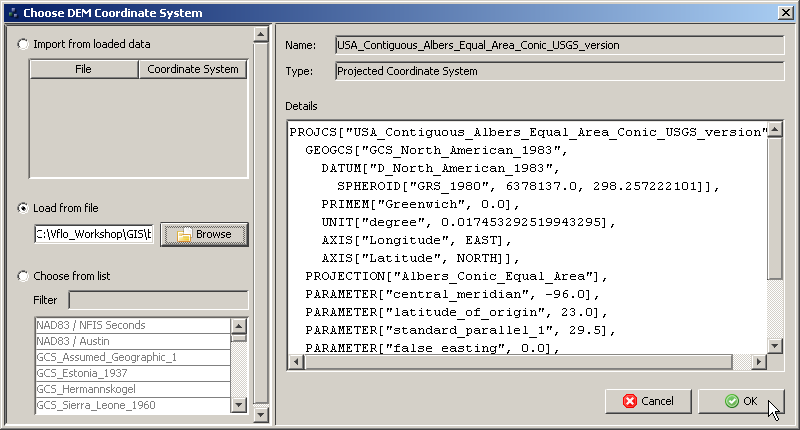
- Once a DEM coordinate system has been successfully selected using one of the three methods described above, projection details will be shown on the right side of the dialog. Click OK to exit the Choose DEM Coordinate System dialog.
3. Designate the vertical units of the DEM.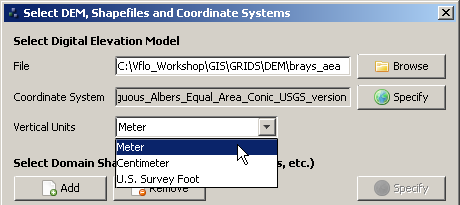
- In the Select DEM, Shapefiles and Coordinate Systems dialog, choose either Meter, Centimeter, or US Survey Foot from the Vertical Units drop down menu.
4. Select domain shapefiles.
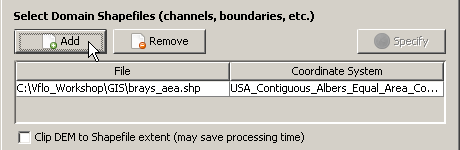
- Click the Add button to load key shapefiles that establish channel locations, desired model domain boundaries, roads, gauge locations, etc. Loading shapefiles is recommended, but not required. In subsequent AutoBOP steps, the shapefiles will provide useful spatial reference for selecting the domain of the Vflo™ model. In addition, channel and boundary shapefiles may be used in future steps to enforce channels and basin boundaries.
-
To remove a shapefile from the list, click on the file name, then click the
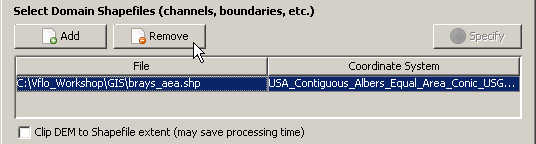
 Remove button.
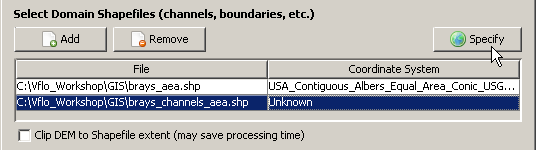
5. Specify the shapefile(s) coordinate system(s).
 If the DEM and all shapefiles are in the same projection, then the coordinate system(s) of the shapefile(s) do not need to be specified. Proceed to step 6.
- If loaded files contain different projections, a coordinate system must be specified for each shapefile to enable reprojection to a common coordinate system. When shapefiles are loaded from directories containing PRJ/WKT files (*.prj), the Coordinate System field will be automatically filled, and no further action is required. If no PRJ file is detected, the Coordinate System field will be marked Unknown, as shown in the example at right. In this case, click the file name, then click the Specify button. Follow the instructions for step 3 above to designate the shapefile coordinate system.
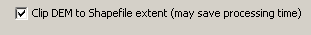
6. Choose whether to clip the DEM to the shapefile(s) extent.
-
Clipping the DEM to the shapefile extent may reduce processing time, especially if the DEM extent is far greater than the extent of the loaded shapefiles. It is not recommended, however, if areas of interest lie outside of the shapefile extent. If desired, check the box next to the text Clip DEM to Shapefile extent.
7. Indicate a Vflo™ Project Directory.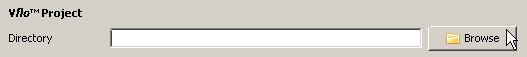
- AutoBOP output files will be saved to the Vflo™ Project Directory. A directory must be chosen in order to proceed. Click the Browse button. In the Choose directory for project dialog, select the desired directory. Note that the File name field will show the entire folder address, not just the folder name. To avoid potential overwrite issues, an empty folder should be chosen. Click Open. In the Select DEM, Shapefiles and Coordinate Systems dialog, the directory address will be shown in the Directory field.
8. Determine whether or not to reproject.
-
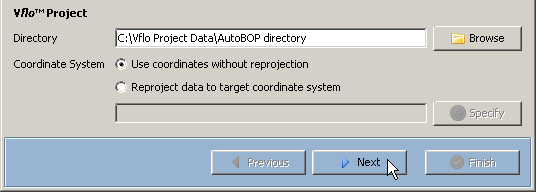 As explained previously, if the DEM and shapefiles are in the same coordinate system, then reprojection is not necessary. Select Use coordinates without reprojection, then click the
 Next button.
 - An error message will pop up, stating, "Proceeding without reprojecting can lead to unexpected results unless all data is in same coordinate system. Continue?" If all data is in the same coordinate system, click Yes to continue. A second pop up message will prompt selection of DEM horizontal units. Select Meter, Centimeter, or US Survey Foot from the drop down menu provided, then click OK.
-
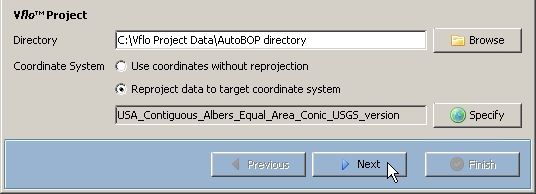 If the DEM and shapefiles are not in the same coordinate system, select Reproject data to target coordinate system. Then, click the Specify button. Follow the instructions provided for step 3, above, to Choose a Target Project Coordinate System. Then, in the Select DEM, Shapefiles and Coordinate Systems dialog, click the Next button. If the Next button is inaccessible, it may be because coordinate systems have not been designated for all data files. Check the DEM Coordinate System and Shapefile Coordinate System fields. When coordinate systems have been selected for all loaded files and a Vflo™ Project Directory has been selected, the Next button will become available.
9. A Processing window will indicate DEM processing progress.
- Processing may take a few minutes to complete, depending on DEM and shapefile size and projection information.
Selecting the domain location and extent
1. Select a Vflo™ model domain.
-
Once processing is finished, the Select Domain Location and Extent dialog will appear. On the right side, the DEM and shapefiles loaded in the previous dialog are displayed.
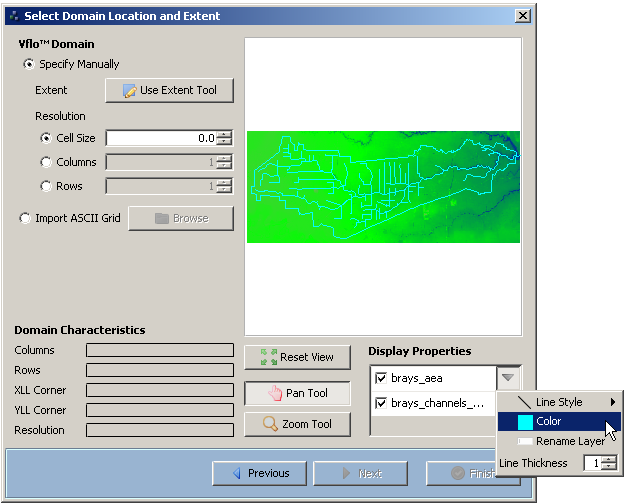
- The Display Properties section, located beneath the display, provides options for adjusting the display in order to locate the desired Vflo™ domain. Use the Display Properties checkboxes and drop down menus to toggle shapefiles on and off, change line style, color, and thickness, rename the shapefiles, or select a different emblem (for point shapefiles only). See the Shapefiles section for detailed instructions on changing shapefile display.
- In addition, use the
 Reset view,
  Pan Tool, and
  Zoom Tool buttons to adjust the display as needed. Detailed instructions for using these tools can be found in the Zooming and Panning sections.
- On the upper left, tools for assigning the Vflo™ domain are available. There are two options for establishing the Vflo™ domain:
- A. Specify Manually
-
To manually designate the Vflo™ domain extent, cell size, and number of columns and rows, select Specify Manually. Then, click the
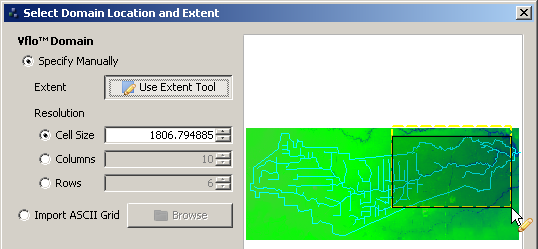
 Use Extent Tool button. Click and drag the cursor within the display to draw in a box representing the extent of the Vflo™ domain. The domain extent box may be re-drawn as many times as necessary.
 - Next, choose the domain Resolution by establishing the Cell Size, number of Columns, and number of Rowsin the model.
By default, the number of Columns is set to "10". The Cell Size and number of Rows are automatically adjusted to provide a best fit for the domain extent box drawn previously. This is indicated by the black shaded box shown in the display. The dotted yellow-line indicates the extent box that was drawn, while the black shaded box represents the best-fit extent based on a default of 10 cell columns. When the Cell Size, Columns, and Rows fields are edited, the black shaded box will automatically adjust in size to represent the resolution specifications. Note that the extent represented by the black shaded box (not the dotted yellow line) is the one that will be used for the Vflo™ domain.
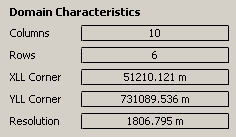
- To adjust cell size, first select the Cell Size option, then type values directly into the Cell Size field or use the Up and Down buttons on the right of the field. Repeat for Columns and Rows until satisfied with the Vflo™ domain extent and resolution shown. The resulting Domain Characteristics are shown in the bottom left corner of the dialog. Click Next.
-
- B. Import ASCII Grid
-
Instead of drawing in the domain extent and manually specifying the domain resolution, an ASCII file may be imported to establish the Vflo™ domain. The body content of the ASCII file does not matter, so long as the header appropriately establishes the number of columns ("ncols"), the number of rows ("nrows"), the lower left x-coordinate ("xllcorner"), the lower left y-coordinate ("yllcorner"), and the resolution ("cellsize"), as demonstrated by the sample ASCII file shown at right. Note that the header values shown at right are for demonstration purposes only; the ASCII file used should contain values representing the desired Vflo™ domain.
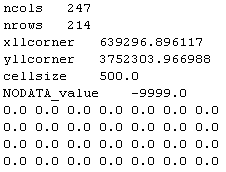
- To import an ASCII grid, select the Import ASCII Grid option, then click the Browse button. In the Choose ASCII File dialog, select the desired ASCII file, then click Open. The Domain Characteristics section on the lower left of the Select Domain Location and Extent dialog will display the resulting domain values. Click Next.
-
- A. Specify Manually
Note: For best results in execution speed and memory requirements, models should contain 30,000 to 50,000 cells in the square grid, and 10,000 to 20,000 solvable cells.
Choosing drainage network options
1. Choose Drainage Network Options.
-
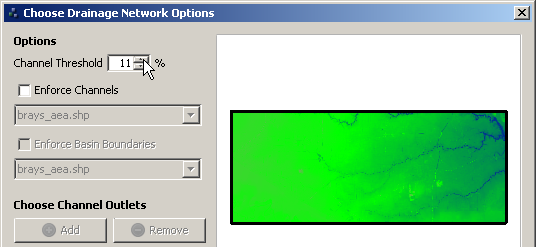 The third dialog in AutoBOP features several options for defining the model drainage network. The Channel Threshold field establishes what percentage of cells in the grid are to be established as channel cells. Use the Up and Down arrows beside the Channel Threshold field, or type a value directly into the field. Then, if channels and basin boundaries are not to be enforced, click Next.
-
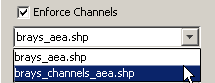
(Optional) To use a previously loaded shapefile to enforce channels, check the Enforce Channels box, then select the shapefile from the drop down list. This will establish all cells intersected by the shapefile as channel cells.
-
(Optional) To use a previously loaded shapefile to enforce basin boundaries, check the Enforce Basin Boundaries box, then choose the shapefile from the drop down list. Drainage network boundaries will be established at all cells intersected by the shapefile. Basin boundaries may be enforced only if channels are also enforced.
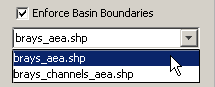
-
When basin boundaries are enforced, it is required to designate channel outlets for flow to be directed through the established boundary. This allows for appropriate conservation of volume calculation. Select the
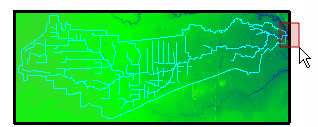
 Add button, then click and drag within the display to draw a box around the desired channel outlet. The channel outlet box must be drawn at the intersection of a channel and the enforced basin boundary, as shown at right. After a channel outlet box is drawn, the coordinates of the channel outlet area will be shown in the Choose Channel Outlets field in the format: [xmin, ymin; xmax, ymax]. Multiple channel outlets may be designated, as needed. To remove a channel outlet, select the channel outlet in the Choose Channel Outlets field, then click the
  Remove button.
 - Once Drainage Network Options are established, click Next.
Clipping the domain by outlet (optional)
1. The next AutoBOP dialog, Clip Domain By Outlet, is optional.
-
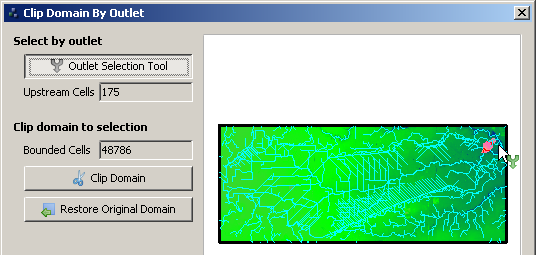 This dialog allows the user to clip the Vflo™ domain to the drainage network connected to a specific outlet cell. The Outlet Selection Tool may be used to clip the domain to the desired drainage network. If this function is not needed, simply click Next.
 - To clip the domain, click the
 Outlet Selection Tool button. Then, click on the outlet cell of the desired drainage network. To assist in selecting the appropriate outlet cell, the Upstream Cells field indicates the number of cells draining to the selected cell. In addition, the network of upstream cells is highlighted in the display. If an incorrect outlet cell is selected, simply click within the display again to re-select the desired outlet cell.
 - Once the outlet is selected, click the
 Clip Domain button. In the display, the black rectangle representing the Vflo™ domain will be re-sized to fit the extent of the selected drainage network. In addition, the Bounded Cells field, which previously indicated the number of cells within the original Vflo™ domain, will indicate the number of cells within the clipped domain.
 - To undo the resizing of the Vflo™ domain, click the
 Restore Original Domain button.
 - When satisfied with the domain extent, click Next.
Note: For best results in execution speed and memory requirements, models should contain 10,000 to 20,000 upstream solvable cells.
Establishing cell parameters
1. Designate cell properties.
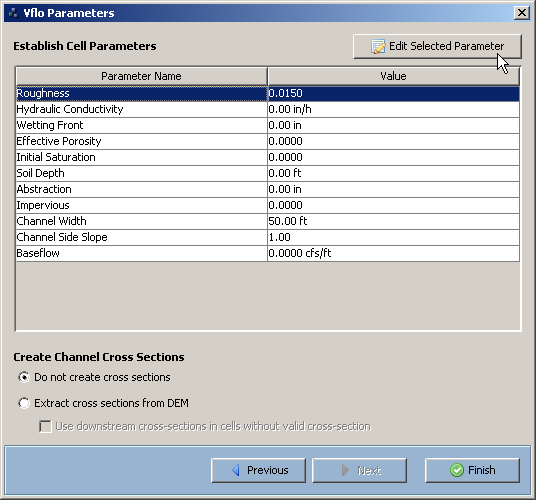
- The final AutoBOP dialog, Vflo Parameters, allows the opportunity to load distributed parameter maps or enter a uniform parameter value for the Vflo™ domain. When first opened, the dialog displays a list of Parameter Names and default Values. To edit a cell parameter, click on the parameter name, then click the
 Edit Selected Parameter button. There are two options for editing a Vflo™ parameter:
- A. Use Uniform Value:
- This option may be used to establish a lumped, approximate value for the entire Vflo™ domain. The value entered will apply to all cells defined by this parameter. To use this option, choose Use Uniform Value, then type the desired value directly into the field provided, or use the Up and Down arrows to adjust the value from its default setting. To apply a different lumped value to channel cells, check the Channel Value box, then enter the desired channel cell value in the Channel Value field. Then, click
 Finish.
- This option may be used to establish a lumped, approximate value for the entire Vflo™ domain. The value entered will apply to all cells defined by this parameter. To use this option, choose Use Uniform Value, then type the desired value directly into the field provided, or use the Up and Down arrows to adjust the value from its default setting. To apply a different lumped value to channel cells, check the Channel Value box, then enter the desired channel cell value in the Channel Value field. Then, click
- B. Import Distributed From File:
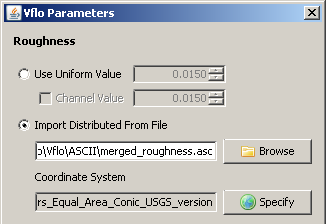
- This option may be used to import a distributed parameter map containing representative values for the watershed. Files may be either ADF or ASCII format (*.adf or *.asc). Instructions for preparing parameter maps using GIS can be found here. To use this option, select Import Distributed From File, then click the Browse button. In the Choose Parameter File dialog, select the desired parameter file and click Open. Then, click the Specify button. Use the choices described in step 3, above, to designate the Coordinate System of the parameter map. Finally, click to return to the list of cell parameters.
- This option may be used to import a distributed parameter map containing representative values for the watershed. Files may be either ADF or ASCII format (*.adf or *.asc). Instructions for preparing parameter maps using GIS can be found here. To use this option, select Import Distributed From File, then click the
- A. Use Uniform Value:
2. Create Channel Cross Sections.
-
As described in the Loading rating curves and cross sections page, cross section cells may be established in Vflo™ using the Hydraulics panel. Alternately, AutoBOP can be used to extract cross sections directly from DEM information, obtaining data pairs of distance and corresponding elevation to be used in calculating the hydraulics of the cell.
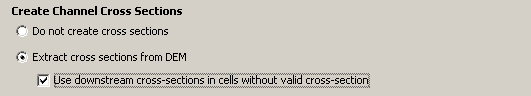
- To bypass this option, select Do not create cross sections. Otherwise, select Extract cross sections from DEM. Check the box to Use downstream cross-sections in cells without valid cross-section if this function is desired. This function forces cross-sections to be used throughout the channel network. Then, click the Finish button.
3. A Processing window will indicate AutoBOP progress.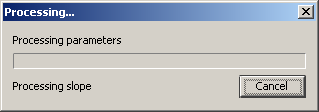
- Processing may take several minutes.
- Once the Vflo™ model is processed, you may wish to:
- Make changes to individual cells or groups of cells (see the Working with cells page for instructions).
- Change the appearance of the Vflo™ display (see Changing the Vflo™ display).
- Calibrate your model (see Overview: Calibration).
- Load precipitation data and solve Vflo™.
Developing a Vflo™ model without GIS
When a DEM and GIS parameter data are available, it is preferable to use AutoBOP and/or GIS software to build a Vflo™ model. However, for certain areas, gridded elevation, soil, and landuse data may not be available. To accommodate this, Vflo™ provides tools for manually drawing in flow direction arrows and assigning model parameters.
Tutorial instructions
For a walk-through demonstration of developing a Vflo™ model without using GIS, see the tutorial instructions: Tutorial: Developing a Vflo™ model without GIS.
Step-by-step instructions
Creating a Vflo™ domain
1. Select File | New to open the Domain Wizard.
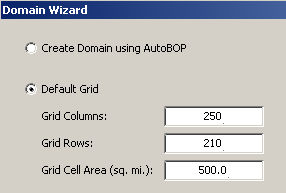
- Within the Domain Wizard window, choose the Default Gridoption. Enter the desired number of columns and rows and the desired cell area (resolution) in the fields provided.
- Alternative methods: Use the shortcut key CTRL+N, or select the Create a new file tool from the Vflo™ Toolbar.
- Alternative methods: Use the shortcut key CTRL+N, or select the Create a new file
2. (Optional) Add a background image.
- If a background image for the modeled area is available, click the Browse button underneath the heading Choose Background Map. Select the desired image file, and click Open.
- Note: Background images must be in one of the following file formats: JPEG (file extension *.jpg), PNG (file extension *.png), or bitmap (file extension *.bmp). For further details on background images, see Background maps and images.
- Back in the Domain Wizard window, click Next.
3. If another Vflo™ model is currently open, you will be asked whether you'd like to save the current basin.
- Click Yes or No.
4. A blank grid with the designated domain and resolution will appear within the Vflo™ Main Display area.
- All cells will be base cells with no assigned flow direction and no other parameter information.
Drawing a flow direction map
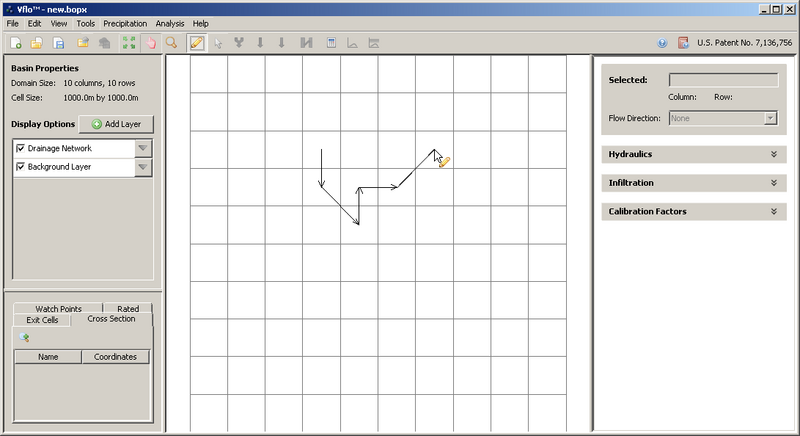
1. To draw a flow direction map, select the Draw ![]() tool from the Vflo™ Toolbar.
tool from the Vflo™ Toolbar.
- As an alternative, select Edit | Draw, or use the shortcut key: CTRL + 3.
- The cursor will become a Draw cursor:
 .
.
2. Click on a cell and drag the cursor to one of the eight neighboring cells.
- A black arrow will appear, originating from the first cell and pointing toward the second, neighboring cell.
3. Draw another arrow by clicking on the second cell and dragging the mouse to one of its neighboring cells.
- Complete this process until flow direction is established for all desired cells.
- Note: Vflo™ does not allow certain drainage patterns. Cells may only be connected to other cells without established flow directions (i.e., a cell may not be connected to a cell that is already included in the drainage network). Circular loops and crossing arrows are prevented. If the user attempts to draw a drainage pattern that is not permitted, no flow direction arrow will appear.
- Not every cell needs to be connected to the drainage network for Vflo™ to solve the network.
4. To clear incorrect flow direction arrows, redraw the arrow to the correct adjoining cell.
- The incorrect arrow will be replaced.
Assigning cell types
Once the Vflo™ domain and drainage network are established, the location of land areas, channels, and reservoirs must be determined. At first, all cells in the Vflo™ grid are base cells (the Vflo™ default cell) with no established parameters. Cell type must be selected for each cell using the Hydraulics panel. Options for cell type include: base, overland, channel, rated channel, cross section, and reservoir cells. Changing cell type may be accomplished on a cell-by-cell basis or as a group.
For step-by-step instructions on assigning cell types, see Changing cell type.
Assigning parameters
As stated previously, when a DEM and GIS parameter data are available, it is preferable to use AutoBOP and/or GIS software to build a Vflo™ model. There are, however, alternative methods if gridded data is not available to parameterize a model. If relative magnitudes of parameters are not known or no GIS maps exist from which to derive parameters, then guidance from expert sources on how to estimate parameter values may be needed.
One possible option is that lumped parameter values can be estimated using assumed relationships, and then calibrated. For example, if soil properties are not known and thus Green and Ampt infiltration parameters cannot be estimated (hydraulic conductivity, wetting front, and effective porosity), a constant hydraulic conductivity rate may be assumed for a particular basin, leaving the other Green and Ampt parameters set to zero. Then through calibration studies, simulated and observed runoff volume can be matched. Hydraulic roughness is another parameter that may be estimated in this way: a lumped value for a watershed may be assumed, then simulated and observed runoff volumes may be matched for calibration. For a demonstration of this process, see Tutorial: Calibrating estimated parameters.
For step-by-step instructions on assigning cell parameters, see Editing cell properties.
Developing a Vflo™ model with GIS maps
As an alternative to using AutoBOP, parameter maps can be developed using GIS software and imported to Vflo™. Detailed instructions on building ASCII parameter maps in GIS are located at Tutorial: Formatting parameter maps in GIS.
All parameter maps must be in ESRI ASCII grid file format. Maps must contain the same number of rows and columns as well as the same lower left x,y coordinates and cell size. This information is found in the header of the ASCII files. (Note: If AutoBOP is used to build a Vflo™ model, then these formatting restrictions do not apply.)
Tutorial instructions
For a walk-through demonstration of developing a Vflo™ model (BOP file) from imported ASCII parameter maps, see the tutorial instructions: Tutorial: Developing a Vflo™ model with GIS maps.
Step-by-step instructions
1. Create a new Vflo™ model (BOP file) from ASCII parameter maps.
- Select File | New to open the Domain Wizard.
- Alternative methods: Use the shortcut key CTRL+N, or select the New tool from the Vflo™ Toolbar.
- Within the Domain Wizard window, select the Use ASCII File option. Click Browse under the text Flow Direction Map and navigate to the prepared ASCII flow direction file. Select Open.

2. (Optional) Load a background image.
- If a background image for the modeled area is available, click the Browse button underneath the heading Choose Background Map.
- Select the desired image file, and click Open. Back in the Domain Wizard window, click Next.
- Note: Background images must be in one of the following file formats: JPEG (file extension *.jpg), PNG (file extension *.png), or bitmap (file extension *.bmp). For further details on background images, see Background maps and images.

3. Select parameter maps for import.
- A second Domain Wizard window will appear, prompting the user to select ASCII files for the following parameters: roughness, hydraulic conductivity, slope, channel width, and channel side slope. Select Browse under each parameter and navigate to the appropriate parameter map file.
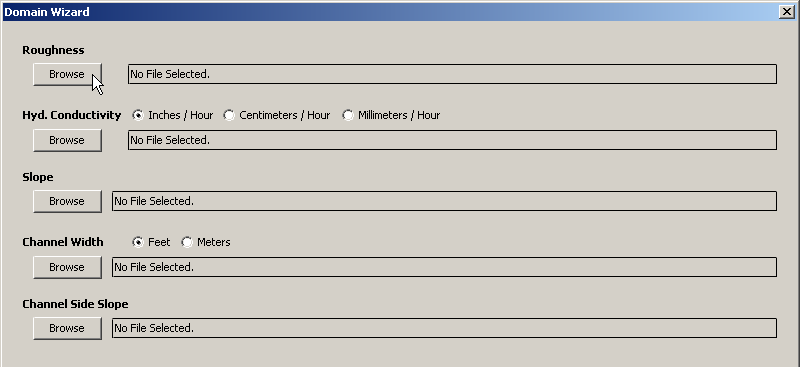
- Once a file has been selected, the path to the file will be shown beside the parameter name.
- For hydraulic conductivity, appropriate units must be selected: Inches / Hour, Centimeters / Hour, or Millimeters \ Hour.
- For channel width, appropriate units must be selected: Feet or Meters.
- Note: Not all parameters listed in the Domain Wizard window must be loaded to develop a new BOP.
4. When satisfied with basin parameters, click Finish.
- Note: Depending on computer hardware and model size, the model may require some time to load.
5. (Optional) Load additional parameter maps.
- Parameter maps may also be developed for the following infiltration parameters: wetting front, effective porosity, soil depth, initial saturation, abstraction, and impervious.
- In addition, parameter maps for baseflow (a property of channel, rated channel, and cross section cells) may be imported to Vflo™.
- To load additional infiltration parameter maps, select Tools | Import ASCII.
6. Save the basin model as a single BOP file.
- Once parameter maps are loaded, it is recommended to save the BOP file by selecting File | Save As.
- Alternative methods: use the shortcut key CTRL+S, or select the Save tool from the Vflo™ Toolbar.
- Once the Vflo™ model has been saved as a BOP file, it may be loaded by selecting File | Open, as described above. The parameter maps will not need to be re-loaded, unless parameter changes are desired.
7. Once the Vflo™ model is loaded and saved, you may wish to:
- Make changes to individual cells or groups of cells (see the Working with cells page for instructions).
- Change the appearance of the Vflo™ display (see Changing the Vflo™ display).
- Calibrate your model (see Overview: Calibration).
- Load precipitation data and solve Vflo™.