Overview: Calibration
Calibration is the process of adjusting model parameter values so that simulated hydrograph results are representative of historic observed results. Completing model calibration is important to prepare for real-time applications of a model, and to ensure that accurate results will be yielded in post-analysis. Calibration requires historical precipitation information and observed hydrograph data at stream gauging stations. Simulated hydrographs are compared to observed hydrographs, then calibration factors are applied to model hydraulic properties and infiltration parameters in order to minimize the differences between the volume, peak discharge, and time to peak of simulated and observed hydrographs. Roughness and hydraulic conductivity are the two parameters that often have the largest impact on hydrograph shape; thus, altering these parameters to better match an observed hydrograph is the basis for model calibration. Channel base width, channel side slope, baseflow, rainfall, soil depth, and several other model parameters, however, may also need to be adjusted in the process of model calibration.
Contents
- 1. Calibration tutorials
- 2. Calibration methods
- 3. Using the Calibration Factors panel
- 4. Using observed data
- 5. Clearing calibration factors
- 6. Using metadata to document calibration
- 7. Using Sensitivity Analyst for calibration
Calibration tutorials
Two tutorials provide calibration instruction: Calibrating estimated parameters, and Model calibration . Use these tutorials to learn how to adjust parameter values and produce representative simulated hydrographs. Calibrating estimated parameters focuses on how to use the Calibration Factors panel to adjust model parameters, while Model calibration guides the user through the general Vflo™ model calibration process. It is recommended to complete Calibrating estimated parameters first, before beginning on Model calibration.
Calibration methods
In general, calibration in Vflo™ proceeds according to the following process:
- After preparing a BOP file to serve as the Vflo™ model, precipitation data for a historic rainfall event is loaded (see Loading rainfall files).
- Watch points are established at stream gauge locations where observed runoff data is available for the historic storm event.
- Observed data is loaded for the watch point cells (see Using observed data).
- Using the Analyze Basin command, Vflo™ is solved to generate discharge hydrographs showing both observed and simulated data for each watch point.
- Simulated hydrographs, shown in black, are compared to observed hydrographs, shown in red. The user hypothesizes which parameters will be calibrated to make hydrographs more correspondent.
- Calibration factors are applied to cell parameters using the Calibration Factors panel (see Using the Calibration Factors panel).
- Steps 4-6 are reapplied as needed until the user is satisfied with model calibration.
- Calibration factors are cleared (see Clearing calibration factors).
The process outlined above may also be performed for a single cell. In this case, watch points do not need to be established, observed data is loaded for the single cell, and the Analyze Cell command (rather than the Analyze Basin command) is used to generate hydrographs.
The list above describes the general process of performing calibration in Vflo™. It is important to note that there are many methods for completing steps 5-7. There are several distinct approaches for comparing simulated hydrographs to observed hydrographs, and for determining how to improve simulated results. One general method is to complete the steps described above, saving a visual reference (such as a screen capture) of the hydrographs generated for each consecutive solve in order to compare the results of different parameter calibrations. This process is continued until a suitable calibration scheme is determined. One more detailed approach is the Ordered Physics-based Parameter Adjustment (OPPA) method. Guidelines for this method are available in several references 12. This method focuses on adjusting hydrograph volume first, then adjusting timing and peak as affected by hydraulic properties. Textual output of hydrographs is saved and percent error for volume (or time to peak, or peak discharge) is calculated, using the observed data as the baseline. Once several solves reflecting adjustment of a single calibration factor have been completed, percent error is plotted against calibration factor to yield a cost function, to which a non-linear trend line may be fitted. From the trend line, minimum percent error may be interpolated, and the corresponding calibration factor may be determined.
Another method, differential calibration by river reach, may be performed by setting boundary conditions at two stream gauge locations. Setting a boundary condition at a cell with observed data forces the solution to the observed at that cell. This method focuses calibration between stream gauges by forcing boundary conditions at the gauge locations and only selecting cells for calibration/analysis that are located between the stream gauges. Generally, it is recommended to complete calibration by proceeding from upstream to downstream. To proceed from downstream to upstream, instead, boundary conditions may be established at downstream cells.
Using the Calibration Factors panel
The Calibration Factors panel features slider bars that are used to apply calibration factors. The following parameter values may be calibrated using the Calibration Factors panel: roughness, hydraulic conductivity, wetting front, soil depth, initial saturation, abstraction, channel width, channel side slope, channel baseflow, and rainfall. Calibration factors range between 0.01 and 5, in increments of 0.01.
Calibration factors act as scalar multipliers for the base parameter value. For example, decreasing the roughness calibration factor to 0.75 means that the next time the Vflo™ model is solved, the Manning’s roughness value used in the routing calculations will be 75% of the base value. With a default base value of 0.015, the calibrated roughness value will be 0.75 x 0.015, or approximately 0.0113.
Calibration factors may be applied to an entire basin, a subbasin, a few selected cells, or an individual cell, depending on which cells are selected when calibration factors are applied. As a general rule, it is a good idea to investigate calibrating channel and overland cells separately, as Vflo™ solves these cells differently. Also, when performing calibration, keep in mind the base parameter values in your watershed. Try to avoid using calibration factors that produce unrealistic parameter values for your area.
Step-by-step instructions
To adjust the calibration factor of a cell or group of cells:
1. First select the cell(s) to be adjusted.
2. Select the Calibration Factors panel tab.
- Adjust the horizontal slider bar for each parameter to be adjusted.
3. Once final calibration values are determined, calibration factors should be cleared.
- To clear calibration factors, select Tools | Clear Calibration Factors.
- This will cause parameter values displayed in the Hydraulics and Infiltration panels to reflect the product of the original values and the calibration factors. All calibration factors will be reset to "1.00".
Using observed data
Loading observed data is necessary to compare observed and simulated hydrographs, an important step in model calibration. Once loaded for a cell, observed data appears as a red line in hydrographs generated for that cell.
Observed data file format for a single cell
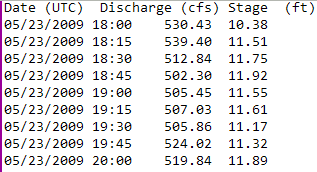
Observed data must be formatted in a tab-delimited text file (*.txt) to be input to Vflo™. When loading data for a single cell, the file must consist of at least two columns. (Two columns may be used if only observed discharge data is available, while three columns may be included if both observed stage and discharge data are available for the cell). The first column should have the text Date or Time in the header row, and should contain dates in the format: MM/DD/YYYY HH:MM. Leading zeros are not necessary; for example, either 09/01/2010 or 9/1/2010 could be used as a date entry. The second column may contain either stage or discharge data. For stage data, the header Stage must be used. For discharge data, the header Discharge or Flow may be used. Data not used in the second column (either stage or discharge) may be included in the optional third column. Columns must be separated with tabs.
Beginning in Vflo™ version 5.1, observed data files may indicate the time zone and units of data by including indicators following the headers described above. For the first column, following the Date or Time header but preceding the 'tab' character delimiter, there may be an optional indication of the time zone of the times listed in the file. This indication must be enclosed in parentheses, and may be any time zone identifier from the Olson time zone database (also known as tz_database and zoneinfo). Care must be taken when selecting the time zone identifier as similar identifiers may nevertheless represent different offsets or daylight savings rules. For instance, to indicate that times are represented in terms of the US Eastern timezone, the header of the first column of the observed data would look like Date (US/Eastern). If the time zone indicator is not present, or cannot be interpreted as a valid time zone identifier, times are interpreted as UTC.
Similarly, parenthetical indications of the stage and discharge units may be included following the Stage and Discharge headers. These indicators must precede the 'tab' character delimiter. Stage units may be loaded as either feet or meters (i.e. Stage (ft) or Stage (m)) and discharge units may be loaded as either cubic feet per second or cubic meters per second (i.e. Discharge (cfs) or Discharge (cms)). Should a valid units indicator not be present, values will be interpreted as feet and cubic feet per second in Vflo™ (US Customary) and meters and cubic meters per second in Vflo™ (metric). Values were also interpreted in these default units in Vflo™ versions prior to 5.1.
An observed data file with both stage and discharge data should have the same formatting as the example below:
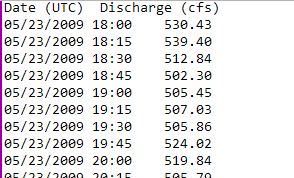
An observed data file with only discharge data should have the same formatting as this example:
USGS data file format for a single cell
Starting in Vflo™ version 5.1, USGS observed stream flow files may be loaded as observed data for single cells. These files may be in either the USGS realtime format, as available from http://waterdata.usgs.gov/nwis/rt, or the in the USGS Instantaneous Data Archive (IDA) format, available from http://ida.water.usgs.gov/ida/.
USGS stream flow files contain stage and/or discharge depending on the source of the data, as well as timezone and units information sufficient to unambiguously relate this observed data to other data. When USGS files are loaded as observed data for a cell, the observed data is associated with the selected cell regardless of that cell's ID or location; no checking is done against the location of the USGS station. These USGS files are a text-based format like Vflo™'s own observed data format; files are interpreted as USGS data when they are loaded (as per the instructions below), with the file extension "rdb".
Observed data file format for basin
Basin observed files contain observed discharge and stage data for several cells in the basin. Basin observed files should be formatted in a tab delimited text file in accordance with the instructions for single cell files above, with the following exceptions.
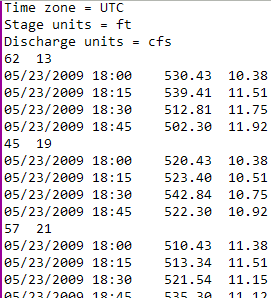
No header line should be included. Instead, include a single identifying row prior to each cell's observed data set containing the cell coordinates, separated by a tab. For example, a basin observed file containing discharge data for Cell(62,13) will include the identifying row: 62 13.
Because no header line is included, if units or time zone is to be specified in Vflo™ versions starting with 5.1, it must be presented on a line by itself at the top of the file. These indications must be prefixed by a number sign (or hash mark) character (#). Time zone indication should be indicated in the format Time zone = ID where ID is a valid time zone identifier from the Olson time zone database. Stage units should be indicated in the form Stage units = ft or Stage units = m, and discharge units should be indicated in the form Discharge units = cfs or Discharge units = cms. If these indicators are not present, time data will be interpreted in the UTC time zone, and values will be interpreted as feet and cubic feet per second in Vflo™ (US Customary) and meters and cubic meters per second in Vflo™ (metric). Values were also interpreted in these default units in Vflo™ versions prior to 5.1.
Basin observed files exported by Vflo™ versions 5.1 and later include unit indicators.
Data lines must list consecutive dates, discharge values, and stage values, each separated by a tab and listed in that exact order. Discharge and stage columns are not interchangeable as they are for single cell observed files, as no header is included in basin observed files. If desired, stage values may be omitted, as in the example basin observed file provided below. Please note that in actual data files, many more timed observations would be present than in this small sample file; additional readings have been omitted in order to showcase the format.
Loading observed data
Observed data may be loaded for a single cell through either the Tools menu, the hydrograph windows, or the Results Manager. Load observed data for the entire basin through the Tools menu.
Step-by-step instructions for loading observed data for a single cell
To use the Tools menu:
1. Select the cell for which an observed data file has been prepared.
2. Select Tools | Load Observed Data.
- Within the Load Observed Data window, navigate to the prepared text file and select Open. The Observed list will appear in the Cell Lists pane, listing all cells for which observed data has been loaded. Now, when Vflo™ is solved at the cell, hydrographs will show both observed and simulated data, facilitating calibration.
To use the hydrograph windows:
1. Solve Vflo™ at a selected cell.
- Within the Stage or Discharge hydrograph windows, select File | Load Observed Data. Navigate to the prepared text file and select Open.
To use the Results Manager window:
1. Locate the solution row for the cell with observed data.
- Then, select the row by clicking on any field in the row.
- Click the Load Observed button located above the Results table. Navigate to the desired file, then click Open.
Step-by-step instructions for loading basin observed data
1. Select Tools | Load Basin Observed.
- Navigate to the desired file and select Open.
Clearing calibration factors
It is important to note that when cells in Vflo™ have been calibrated, the cell parameter values remain unchanged. This means that, although several important Vflo™ processes take calibration factors into account, the cell parameter values shown in the Cell Properties pane remain the base values, not the calibrated values.
Vflo™ processes that take calibration factors into account include:
- Calibration factors are applied to base values when solving.
- Parameter statistics generated by Network analysis take into account calibration factors.
- Calibration factors are saved in the BOP file so that when the model is re-opened, the same calibration factors will continue to be applied in solving Vflo™.
Vflo™ processes that do not take calibration factors into account include:
- The values shown in the Cell Properties pane (and in the Hydraulics and Infiltration panels) remain the original, uncalibrated cell parameters.
- When ASCII parameter maps are exported from Vflo™, the base values, rather than the calibrated values, are exported.
Thus, it is prudent to check the Calibration Factors panel upon opening a Vflo™ model, so that no unexpected results occur. In addition, before parameter maps are exported from Vflo™, it is necessary to clear calibration factors. Clearing calibration factors resets the parameter values exhibited in the Hydraulics and Infiltration panels to show the calibrated values rather than the base values, by multiplying the original base value with the corresponding calibration factor. Calibration factors are set back to one, and exported parameter maps will contain calibrated values.
Step-by-step instructions
1. Clear calibration factors.
- Select Tools | Clear Calibration Factors.
Using metadata to document calibration
Metadata is an excellent resource for tracking and documenting the calibration process. Calibration factors applied and observations of the resulting simulated hydrographs may be noted in the Metadata field. Metadata entries are saved as part of the BOP file.
Using Sensitivity Analyst for calibration
The Vflo™ extension Sensitivity Analyst may be used to augment the calibration process. Sensitivity Analyst is a powerful utility for exploring model response to a range of parameter values and for identifying optimal parameter sets. Sensitivity Analyst runs Vflo™ for input parameter values and generates peak discharge, volume, and time-to-peak as output for each parameter combination. For further information on the Sensitivity Analyst extension, see the Sensitivity Analyst page.
- 1. Vieux, B.E., and F.G. Moreda, 2003. Ordered Physics-Based Parameter Adjustment of a Distributed Model. Chapter 20 in Advances in Calibration of Watershed Models. Edited by Q. Duan, S. Sorooshian, H.V. Gupta, A.N. Rousseau, R. Turcotte, Water Science and Application Series, 6, American Geophysical Union, ISBN 0-87590-355-X pp. 267-281.
- 2. Vieux, B.E., and P.B. Bedient, 2004. Assessing urban hydrologic prediction accuracy through event reconstruction. 'J. of Hydrol.' 299(3-4), pp. 217-236. Special Issue on Urban Hydrology.