Solving Vflo™
Solving a cell generates statistical results, stage hydrographs, and discharge hydrographs for the selected cell. Before solving Vflo™, a Vflo™ model must be developed and precipitation must be loaded.
Contents
Solving a single cell
Step-by-step instructions
1. Select a cell.
2. To solve, select Analysis | Analyze Cell.
- Alternately, click the Analyze Cell tool, or press the shortcut key, F5. The Analysis Options window will pop up.
3. Enter Analysis Options choices.
- For detailed descriptions of each analysis option, see below.
- Click in the Prediction Length field and type in the desired solve period, in hours.
- If channel routing options are desired, click either Use Modified-Puls or Use Jones.
- If stage data is to be exported, select Store Stage Hydrographs.
- When Analysis Options are established as desired, click Finish.
4. View results.
- Once Vflo™ has completed solving, the Results window will appear. The Results window keeps a log of each cell solution that has been made since Vflo™ has been opened. The most recent solution will appear as the last row in the Results table. See Interpreting Vflo™ results for information on using and interpreting the data shown in the Results window.
5. Open hydrographs.
- Double click on the cell's solution row to open stage and discharge hydrographs. See Viewing hydrographs for information on interpreting hydrograph results and using the hydrograph windows.
Solving all watch points
The Analyze Basin function allows for all watch points to be solved at once, especially useful for flood watch and calibration purposes.
Step-by-step instructions
1. Establish watch points at stream gauge locations, flood watch points, or other cells of interest.
2. Select Analysis | Analyze Basin.
- Alternately, click the Analyze Basin
 tool, or use the shortcut key F12.
3. Enter Analysis Options choices, as described above.
- Selections made in the Analysis Options window will be applied in solving each watch point.
4. View results.
- Each watch point solution will appear as a separate row in the Results window. Use the Cell column to identify which row corresponds with each watch point.
5. Open hydrographs.
- To open a hydrographs for a particular watch point, double click the watch point's row. Stage and discharge hydrographs for the watch point will appear in separate windows.
Analysis options
The Analysis Options window is used to establish solve settings. Choices are included for prediction length, channel routing, and for storing stage hydrographs. Once entered, Analysis Options are saved as a Vflo™ configuration setting. Analysis Options are not saved in the BOP file. Each option is described in detail below.
Step-by-step instructions for opening Analysis Options
1. Select Analysis | Analysis Options.
- Note: the Analysis Options window will also appear each time Vflo™ is solved for a single cell or for the basin.
Prediction length
Prediction length is the number of hours past the end of rainfall input that a hydrograph will be computed for. It is important to consider the size of the Vflo™ model and the purpose of the solve, in order to determine the desired prediction length. A large basin or a cell with a large watershed area will have a more delayed response. It may be necessary to solve with a long prediction length in order to adequately represent the volume of streamflow produced. For exploratory studies and calibration, however, a shorter prediction length may be selected to quickly solve for a hydrograph. Once satisfactory rising limb and peak hydrograph characteristics are obtained, a longer length may be selected to see the full response of the hydrograph, particularly in the recession limb.
Channel routing options
Channel routing options include Modified-Puls and the Jones Equation.
Modified-Puls takes channel storage volume into account. Modified Puls routes flow from one channel cell to the next using the stage-volume and stage-discharge relationship defined by the rating curves or trapezoidal cross-section representing the channel. The outflow hydrograph from one grid cell becomes the inflow hydrograph in the next channel cell downstream. Modified Puls has the effect of delaying and attenuating the hydrograph peak, depending on channel storage volume.
The Jones option implements a looped rating curve modification. The Jones Equation accounts for inertial effects in low-gradient channels during rising and falling hydrograph limbs. See Open Channel Flow by Henderson (1966) for more details on looped rating curves and the Jones formula correction.
Storing stage hydrographs
Selecting Store Stage Hydrographs in the Analysis Options window allows for export of distributed time specific stage data. For further details, see Exporting stage data.
Instabilities
Rapidly increasing rainfall rates can cause instabilities in the hydrograph that are evidenced by spikes in flow rate, rather than a smoothly changing hydrograph. The model computes the time step subject to the Courant condition for the rainfall input and parameters governing the hydraulics of overland or channel flow, i.e. roughness and slope. The user can modify these parameters or the rainfall input to reduce or remove very high rainfall intensities and reduce instabilities should they occur.
Interpreting Vflo™ results
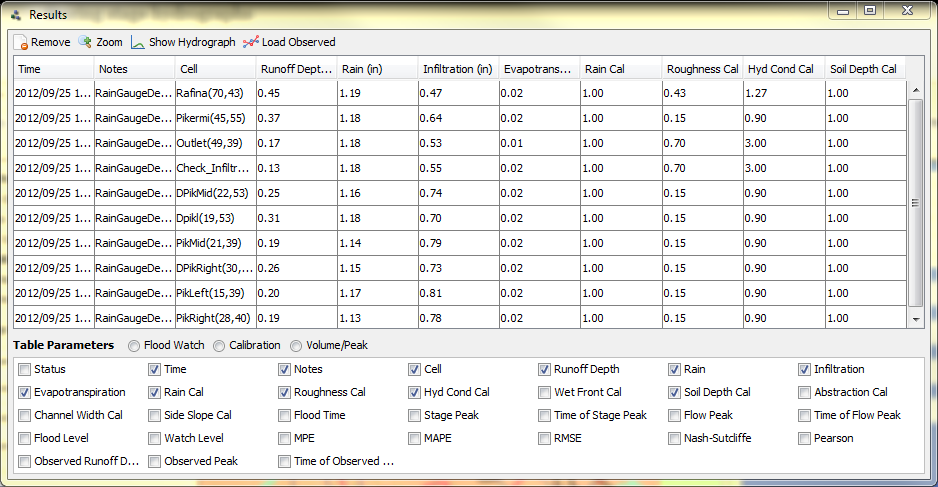 The Results window reports an array of rainfall and runoff results, confirms calibration factors applied in solving, supplies statistical analyses for calibration purposes, and provides Flood Watch reports. Each reporting category of the Results window is described in detail below. Any of the results reports (Calibration Report, Volume/Peak Report, and Flood Watch Report) can be modified using the Results View menu.
Step-by-step instructions for customizing Results
1. In the bottom of thr Results window, select an available report (Flood Watch, Calibration, or Volume) from the Table Parameters radio-type selector.
2. Further customize the report by selecting parameters using the checkboxes in the area below.
- All checked items will be displayed as columns in the Results chart.
Calibration Report
The Calibration report assesses average depth of runoff, rainfall, infiltration, and evaporation; states applied calibration factors; and provides statistical analyses of difference between simulated and observed hydrographs. Each column of the report is described below.
- Time: The time at which Vflo™ was solved.
- Notes: Provides space to add notes identifying the model parameter settings in effect when Vflo™ was solved. These notes are not saved when the Results window is closed, and are not stored in the BOP file.
- Cell: States the cell name. If a name for the cell was not previously established in the Selected Cell panel, the default name for the cell will appear (e.g., Cell(42,57)).
- Runoff Depth: Average runoff depth for the hydrograph.
- Rain: Average rainfall depth.
- Infiltration: Average depth of infiltration.
- Evapotranspiration: Average depth of evapotranspiration.
- Rain Cal: Rainfall calibration factor applied in the Calibration Factors panel.
- Roughness Cal: Roughness calibration factor applied in the Calibration Factors panel.
- Hyd Cond Cal: Hydraulic conductivity calibration factor applied in the Calibration Factors panel.
- Soil Depth Cal: Soil depth calibration factor applied in the Calibration Factors panel.
- MPE: Mean percentage error. In Vflo™, MPE is the average percent error by which simulated hydrograph values differ from observed hydrograph values. Values will only appear in this column when observed data has been loaded for the solved cell.
- MAPE: Mean absolute percentage error. Values shown only when observed data is loaded for the solved cell.
- RMSE: Root mean square error, as defined by the equation
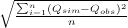 , in which
  is simulated discharge and
  is observed discharge. Values shown only when observed data is loaded for the solved cell.
- Nash-Sutcliffe: Nash-Sutcliffe model efficiency coefficient, as defined by the equation
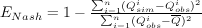 , in which
  is modeled discharge at time
  , and
, and  is observed discharge at time . Values shown only when observed data is loaded for the solved cell.
- Pearson: Pearson correlation coefficient, as defined by the equation
 , where
  is the covariance between observed and simulated results,
  is the observed standard deviation, and
  is the simulated standard deviation.
Volume/Peak Report
The Volume/Peak Report focuses on simulated and observed hydrographs' peak flow. This report may be useful in completing model calibration. The Time, Notes, Cell, and Runoff Depth columns are as described for the Calibration Report above. Remaining report columns are described below.
- Observed Runoff Depth: Average runoff depth of observed data.
- Flow Peak: Peak flow of the simulated hydrograph.
- Observed Peak: Peak flow of the observed hydrograph.
- Time of Flow Peak: Time at which peak flow of the simulated hydrograph occurs.
- Time of Observed Peak: Time at which peak flow of the observed hydrograph occurs.
Flood Watch Report
The Flood Watch Report contains information about when Watch and Flood levels (established for watch points) are reached in simulated hydrographs. The Time, Notes, and Cell columns are as reported for the Calibration Report above. Remaining report columns are described below.
- Flood Watch Icon: This column features graphic indicators of flood level. As described in Establishing watch points, a Watch Level and a Flood Level may be established for any watch point cell. A green circle in the Flood Watch column indicates that the Watch Level has not been approached. A yellow triangle indicates that hydrograph results have come within 20% of the Flood Level. A red circle indicates that the Watch Level is reached. Finally, a black diamond indicates that the Flood Level is reached in the hydrograph results. Icons are only shown when cell is a watch point with established Watch and Flood levels.
- Flood Time: The time at which the Flood Level is reached.
- Stage Peak: Maximum simulated stage at the cell location.
- Time of Stage Peak: The time at which Stage Peak is reached.
- Time of Flow Peak: Maximum simulated discharge at the cell location.
- Flood Level: Displays the Flood Level setting for the watch point. Values are shown only when cell is a watch point with established Watch and Flood levels.
- Watch Level: Displays the Watch Level setting for the watch point. Values are shown only when cell is a watch point with established Watch and Flood levels.
Viewing hydrographs
 Step-by-step instructions for solving Vflo™ and generating hydrographs are included above. This section focuses on interpreting hydrograph results.
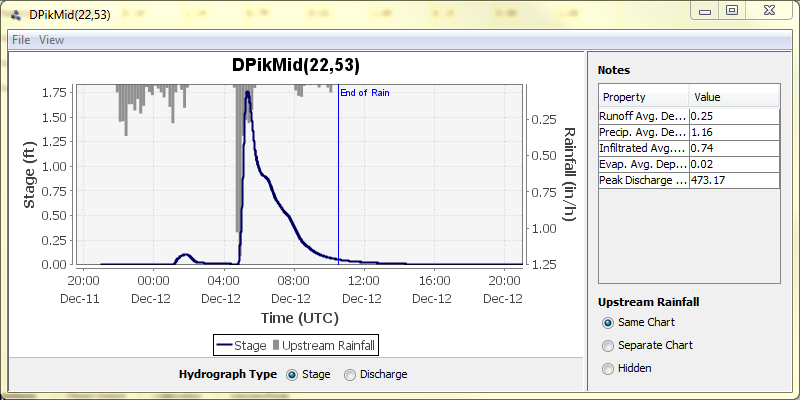
Stage and discharge hydrographs may be selected using the Hydrograph Type radio-type selector at the bottom of the window.
The stage hydrograph indicates simulated depth, in either feet or meters, over the timeperiod of the established Prediction length. The blue vertical line indicates the time of the last rainfall input. When viewing stage hydrographs for watch points with established Watch and Flood levels, shaded yellow and red areas may be visible on the graph. Stage results within the yellow shaded area are at the Watch level. Stage results within the red shaded area are at the Flood level.
Discharge hydrographs indicate flow rate, either in cfs or cms, over the timeperiod of the established Prediction length. If observed data has been loaded for the cell, then both a red curve and a black curve will be shown. The red curve is the observed hydrograph, while the black curve is the simulated hydrograph. The blue vertical line indicates the time of the last rainfall input.
Rainfall upstream of the selected cell is shown as a gray bar graph extending down from the top of the hydrograph plot area. This rainfall data may be hidden or shown as a separate plot using the Upstream Rainfall selector on the bottom right.
On the top right, key statistics are reported, including:
- Runoff Average Depth
- Precipitation Average Depth
- Infiltrated Average Depth
- Evapotranspiration Average Depth
- Peak Discharge
For step-by-step instructions on exporting hydrograph data, see Exporting hydrographs.
For step-by-step instructions on loading observed data from the hydrograph windows, see Loading observed data.
Step-by-step instructions for changing hydrograph units
1. In either the Discharge or Stage hydrograph windows, open the View menu.
2. Select the desired units from the menu.
Viewing continuous simulation results
1. Continuous output is provided at each watchpoint
2. Degree of saturation is the average of the cells upstream of the watchpoint
3. Discharge at each watchpoint is shown as an average for the timestep entered during continuous simulation