Loading Rating Curves and Cross Sections
In Vflo™, there are three types of channel cells:
- 1. Channel cells: Also called trapezoidal channel cells, these cells use channel width and channel side slope parameters to define the hydraulics of the cell.
- 2. Rated channel cells: These cells use stage-area and stage-discharge rating curves to define channel hydraulics.
- 3. Cross section cells: These cells use cross sections (measured pairs of distance and elevation) to define channel hydraulics.
In addition, there are reservoir cells, which use stage-storage and stage-discharge curves.
Rated channel cells and cross section cells should be assigned where complex hydraulics occur due to compound cross section, roughness elements, or hydraulic structures. In addition, reservoir cells should be assigned as neccessary, and rating curves loaded to define reservoir hydraulics. Cell type is changed through the Hydraulics panel.
Assigning rated channel, cross section, and reservoir cells occurs after the initial steps of basin model development have been completed and channel cells have been established. AutoBOP or GIS software is used to process a digital elevation model (DEM) for the basin. In many cases, a channel shapefile is used, as well, to force appropriate flow directions near channels. Then, channel width and channel side slope parameters are developed as ASCII parameter maps and imported to Vflo™, or the trapezoidal cross section parameters are edited using the Hydraulics panel within Vflo™. At this point, channel cells are changed to rated channel cells or cross section cells where the required data is available, and reservoir cells may be assigned.
Contents
- 1. Preparing rating curve and cross section data files
- 2. Exporting rating curve files
- 3. Establishing rated channel cells and loading rating curves
- 4. Viewing a list of rated channel cells
- 5. Establishing cross section cells and loading cross section data
- 6. Viewing a list of cross section cells
- 7. Establishing reservoir cells and loading rating curves
Preparing rating curve and cross section data files
Use the Hydraulics panel to enter rating curve and cross section data. Discrete pairs of area-stage and stage-discharge (rated channel cells), distance-elevation (cross section cells), and storage-stage and stage-discharge (reservoir cells) are used to characterize hydraulic performance. These data pairs may be entered manually within Vflo™, or imported as text files. To use a text file, follow the formatting guidelines below. Rating curve and cross section files may be imported for a single cell or for an entire basin.
Formatting rating curve and cross section files for a single cell
Use a tab-delimited text file with two columns, as shown in the sample below. Do not include a header row; the first line of the file will be the first data point. Values must be entered in ascending order. For example, for cross sections, distance-elevation pairs should be sorted by distance in ascending order (increasing distance). If the chart is not displayed after values are entered, the values are not in ascending order. For cross section cells, either a convention of looking downstream or upstream may be adopted, at the user's preference.
Vflo™ will assume the order of the two columns being imported are the same order as shown in the Vflo™ table for the rating curve or cross section. The table for each curve/cross section is located in the window that appears when the Show Curve ![]() or Edit Curve
or Edit Curve ![]() tools are selected. These tools are located below the graphs in the Hydraulics panel. Take note that, for certain curves, the graph name will present the data categories in a different order than the Vflo™ table. For example, the first graph shown for reservoir cells is called the Stage-Storage Curve, but the table shown in the Storage-Stage Curve window has Storage as the first column, and Stage as the second column; thus, text files must have Storage as the first column and Stage as the second column, as well.
tools are selected. These tools are located below the graphs in the Hydraulics panel. Take note that, for certain curves, the graph name will present the data categories in a different order than the Vflo™ table. For example, the first graph shown for reservoir cells is called the Stage-Storage Curve, but the table shown in the Storage-Stage Curve window has Storage as the first column, and Stage as the second column; thus, text files must have Storage as the first column and Stage as the second column, as well.
Additionally, Vflo™ will assume the units of the two columns being imported are the same units as shown in the Vflo™ table for the rating curve or cross section. Area values should be in units of square meters (metric) or square feet (US customary). Stage values should be in units of meters (metric) or feet (US customary). Discharge values should be in units of cms (metric) or cfs (US customary). Distance values should be in units of meters (metric) or feet (US customary). Elevation values should be in units of meters (metric) or feet (US customary). Storage values should be in units of m3 (metric) or ft3 (US customary).
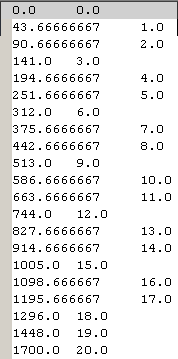
The sample rating curve file below contains area-stage data for a rated channel cell. The first column contains area data in square feet, the second column contains stage data in feet.
Formatting rating curve and cross section files for the basin
Basin rated channel files
Use a tab delimited text file with two columns. Area-stage and stage-discharge data should be listed for each rated channel cell in sequence, in accordance with the single cell formatting instructions above. For each cell, area-stage data must be listed first, followed by stage-discharge data. Prior to each area-stage data set, include two identifying rows. In the first row, enter the coordinates of the rated channel cell, separated by a tab (e.g., for a rated channel cell located at (101,152), enter "101 152"). In the second row, enter the number of rows in the subsequent data set (e.g., for an area-stage curve with thirty-one data pairs, enter "31" in the second row). Then, preceding each stage-discharge data set, include a single identifying row with the number of rows in the stage-discharge data set (e.g., for a stage-discharge curve with twenty-nine data pairs, enter "29").
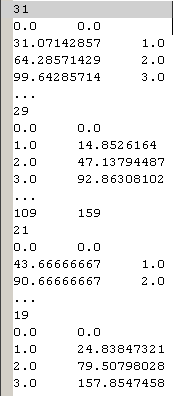
The sample basin rated channel file below shows area-stage and stage-discharge pairs for two rated channel cells: the first with coordinates (101,152), the second with coordinates (109,159). Cell (101,152) has thirty-one area-stage data pairs and twenty-nine stage-discharge data pairs, while the cell located at (109,159) has twenty-one area-stage pairs and nineteen stage-discharge pairs. Note that the file has been edited for ease of viewing; "..." marks that rows are omitted. For actual basin rated channel files, full sets of area-stage and stage-discharge data will need to be included.
Basin cross section files
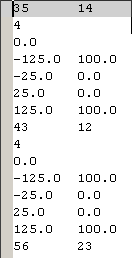
Use a tab delimited text file with two columns. Distance-elevation data should be listed for each cross section cell in sequence, in accordance with the single cell formatting instructions above. Before each set of distance-elevation data, include two identifying rows. In the first row, enter the coordinates of the cross section cell, separated by a tab (e.g., for a cross section cell located at (35, 14), enter "35 14"). In the second row, enter the number of rows in the subsequent data set (e.g., for a cross section with four data pairs, enter "4" in the second identifying row). The sample basin cross section file below demonstrates the appropriate file format.
Exporting rating curve files
See the Exporting data from Vflo™ page for step-by-step instructions.
Establishing rated channel cells and loading rating curves
Step-by-step instructions
1. Establish a rated channel cell.
- Select the desired cell and open the Hydraulics panel. From the Cell Type drop-down menu, select Rated Channel Cell. Rated channel cells have infiltration parameters and the properties of slope and baseflow, as well as rating curves: a Stage-Area Curve and a Stage-Discharge Curve. When a rated channel cell is first established, the default curves (straight lines) must be edited to represent the measured data for that cell.
2. Load the Stage-Area Curve.
- Select the Edit curve above
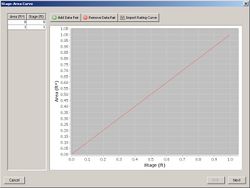
 tool located below the Stage-Area Curve. The default Stage-Area Curve will appear in its own window, as shown at right. Select the Import Rating Curve
  tool and navigate to the appropriate text file (see above for file formatting details). Then, select Open. The area-stage table on the left side of the Stage-Area Curve window will be populated with the values of the imported text file, and the stage-area curve will be plotted. Click Next to return to the main screen.
- As an alternative, rating curves may be manually entered. For this method, select the Edit curve above tool located below the Stage-Area Curve in the Hydraulics panel. Enter area-stage pairs directly into the left-side table of the Stage-Area Curve window. Double click on the first Area field and type in the desired value. Then, double click on the first Stage field, and type in the desired value. To add rows, select the Add Data Pair
 button. To delete rows, select the Remove Data Pair button
  .
. - Use appropriate units and enter data pairs in ascending order, as described above.
3. Load the Stage-Discharge Curve.
- Repeat Step 2 above for the Stage-Discharge Curve. Click the Edit curve above tool located below the Stage-Discharge Curve. Then, within the Stage-Discharge Curve window, either import a prepared discharge-stage text file using the Import Rating Curve tool, or enter discharge-stage values manually as described in Step 2. Once satisfied with the Stage-Discharge Curve, click Next to return to the main screen.
Viewing a list of rated channel cells
In model development, it may be helpful to note the number, location, or name of cells that have been established as rated channel cells. The Cell List pane, located on the lower left of the Vflo™ interface, is a useful resource for lists of special cells.
Step-by-step instructions
1. View a list of rated channel cells.
- Open the Rated channel cell list by clicking on the Rated tab located in the Cell List pane.
2. Zoom to a specific rated channel cell.
- To select and zoom to a cell in the Rated list, click on the cell name and select the Zoom
 tool located at the top of the list.
Establishing cross section cells and loading cross section data
Step-by-step instructions
1. Establish a cross section cell.
- Select the desired cell and open the Hydraulics panel. In the Cell Type field, select Cross Section from the drop-down menu. The properties of cross section cells will appear in the Hydraulics panel: roughness, slope, baseflow, base elevation, and a Cross Section. The default Cross Section shown will need to be edited to represent actual distance-elevation data.
2. Load cross section data.
- Select the Edit curve tool located beneath the Cross Section in the Hydraulics panel. The default cross section table and graph will appear in a new, enlarged Cross Section window. Click on the Import Rating Curve tool located above the graph, navigate to the prepared tab-delimited text file, then click Open. (See above for file formatting details.) The distance-elevation table on the left side of the Cross Section window will be populated with distance-elevation data pairs and the graph will be plotted. Select Next to return to the main screen.
- Distance-elevation pairs may also be manually entered and edited. To do so, double click on the first Distance field in the distance-elevation table and enter the desired values. Then, double click the first Elevation field and enter the desired corresponding elevation data. Use the Add Data Pair and Remove Data Pair tools to add and remove rows from the table as desired.
Viewing a list of cross section cells
The Cell List pane, located on the lower left of the Vflo™ interface, is a useful resource for lists of special cells. To generate a list of cross section cells, follow the instructions below.
Step-by-step instructions
1. View a list of cross section cells.
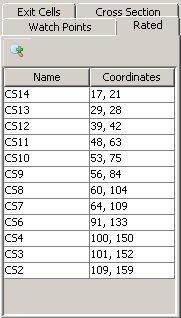
- Open the Cross Section list by clicking on the Cross Section tab, located in the Cell List pane. The names and coordinates of all cross section cells will be shown.
2. Zoom to a specific cross section cell.
- Click on a cross section cell's name, then click the Zoom tool located at the top left of the list. This will select the cell and zoom to it within the Main Display.
Establishing reservoir cells and loading rating curves
Step-by-step instructions
1. Establish a reservoir cell.
- Select the desired cell, open the Hydraulics panel, and select Reservoir for Cell Type. Reservoir cells have the property of initial storage, as well as rating curves: a Stage-Storage Curve and a Stage-Discharge Curve. When a reservoir cell is first established, the default curves are straight lines that must be edited.
2. Load the Stage-Storage Curve.
- Select the Edit curve above tool located below the Stage-Storage Curve. The default Stage-Storage Curve will appear in its own window. Select the Import Rating Curve tool and navigate to the appropriate text file (see above for file formatting details). Then, select Open. The storage-stage table on the left side of the Storage-Stage Curve window will be populated with the values of the imported text file, and the stage-storage curve will be plotted. Click Next to return to the main screen.
- Rating curves may also be manually entered. For this method, select the Edit curve tool located below the Stage-Storage Curve in the Hydraulics panel. Enter storage-stage pairs directly into the left-side table of the Storage-Stage Curve window. Double click on the first Storage field and type in the desired value. Then, double click on the first Stage field, and type in the desired value. Use the Add Data Pair and Remove Data Pair tools to add and delete rows as needed.
3. Repeat Step 2 for the Stage-Discharge Curve.