Network Analysis
Vflo™ Network Analysis provides the ability to analyze an upstream network of specific cells. Network Analysis is displayed in the Network Statistics window, which features information about the network of cells that drain to a selected cell. Note that conducting Network Analysis on cells without any inputs will not yield useful information.
Step-by-step instructions for generating Network Statistics
1. Select the cell for which Network Analysis is desired.
- Network Statistics will be generated for the network of cells that drain to the selected cell.
2. Select the Network Statistics ![]() tool of the Vflo™ Toolbar.
tool of the Vflo™ Toolbar.
- The Network Statisticswindow will appear.
- Alternate methods: Select Analysis | Network Analysis, or use the shortcut key: F1.
Using Network Statistics
Four areas of information are included in the Network Statistics window, described below.
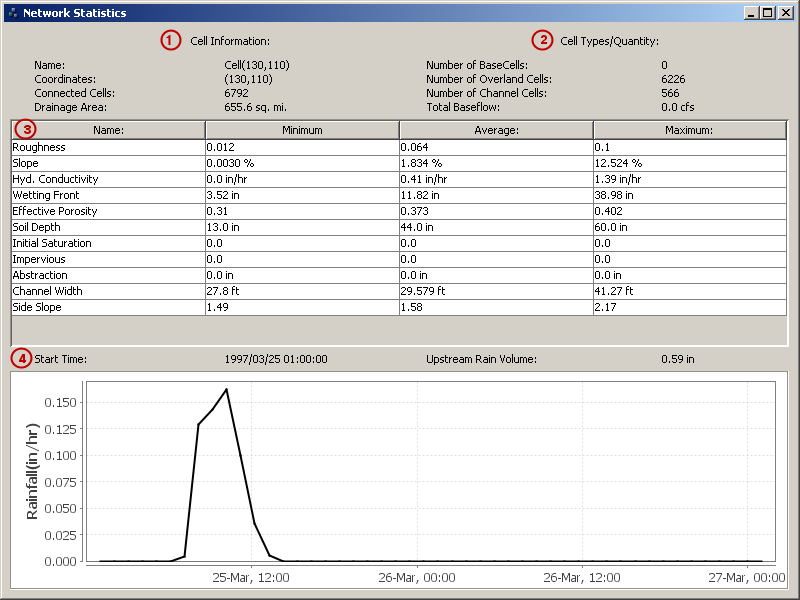
1. Cell Information
- The Cell Information area is located at the top left corner of the Network Statistics window. The Name and Coordinates of the selected cell (the output cell of the network) are displayed, as well as the number of Connected Cells and the Drainage Area. Drainage Area is calculated by multiplying the area of a single grid cell by the number of Connected Cells.
2. Cell Types/Quantity
- The number of cells and type of cells that create the upstream network are listed in the Cell Types/Quantity area, located at the top right corner of the Network Statistics window. The Number of Base Cells, Number of Overland Cells, and Number of Channel Cells are listed. In addition, the Total Baseflow is indicated.
3. Parameter Statistics
- The Parameter Statistics table lists the minimum, maximum, and average value for key Vflo™ parameters. For example, in the Network Statistics window shown above, the lowest Roughness value in the network of connected cells is 0.012. The maximum Roughness value in the network is 0.1. The average Roughness value for the network is 0.064. Parameters include: Roughness, Slope, Hydraulic Conductivity, Wetting Front, Effective Porosity, Soil depth, Impervious, Abstraction.
4. Network Average Hyetograph
- A hyetograph showing network-averaged rainfall values is displayed at the bottom of the Network Statistics window. Above the hyetograph, the Start Time of the rainfall event is indicated, as well as the Upstream Rain Volume. Comparing the Upstream Rain Volume with the streamflow volume at the output cell is useful for calibration studies, and for documenting input and output at a specific cell location.