Overview: Precipitation
Vflo™ can simulate runoff based on gridded rainfall produced from radar, point rainfall measured at rain gauge locations (see Importing a file for a single rain gauge or design storm and Interpolated gauge), or hypothetical design storms such as the SCS Type II (see Generating a SCS type design storm). Using archival rainfall data, historical events can be simulated and used to calibrate the model to observed streamflow. Once loaded, rainfall input can be animated to show rainfall maps over the basin. In addition, a hyetograph may be plotted for any location for which rainfall has been loaded.
The source of the precipitation input data does not matter as long as one of two requirements is met: 1) Maps are in the same resolution as the base parameter maps or 2) If the maps are not in the same resolution as the base parameter maps, then a filter file must be created to properly index the resolution of the precipitation maps to that of the Vflo™ domain. Due to the large number of radar formats and resolutions, generally a filter file must be created to filter the rainfall into the Vflo™ model domain. For detailed instructions, see Creating filter files.
Rainfall data imported to Vflo™ can be saved as a single Rainfall Rate Properties file, or RRP (see Saving rainfall data). Once the RRP file is produced, it can easily be loaded again without re-loading from source files (see Existing RRP files).
Instead of loading rainfall for the entire domain, it is possible to load rainfall only over a select group of cells (see Selecting cells). If rainfall is loaded while multiple cells are selected, then rainfall input will only be loaded over the selected cells. Otherwise, rainfall is loaded for the entire domain. Producing a RRP file for selected areas can reduce the memory requirements if rainfall for the entire domain, outside of the basin, is appropriately excluded.
Processed radar rainfall produced through combination of radar and gauge can be loaded directly into Vflo™. Vieux & Associates, Inc. offers services to rain gauge correct and format radar data for use in Vflo™ and other hydrologic applications. Radar data alone, without adjustment with rain gauges, may not produce satisfactory results if matching actual streamflow hydrographs is desired.
Contents
- 1. Loading rainfall files
- 2. Saving rainfall data
Loading rainfall files
To load rainfall files, use the Rainfall Wizard. Click the Load precipitation ![]() tool, or select Precipitation | Load Precipitation. The Vflo™ Rainfall Wizard supports four methods for loading rainfall, including:
tool, or select Precipitation | Load Precipitation. The Vflo™ Rainfall Wizard supports four methods for loading rainfall, including:
- Existing RRP Files – RRP files (*.rrp) that have been saved from Vflo™ can be loaded using the Browse button.
- Design Storm – Spatially uniform rainfall depth is created manually or from text files.
- Interpolated Gauge – Spatially distributed rainfall maps are created from gauge hyetographs.
- New Rainfall Files – Spatially distributed rainfall maps are created from spatially variable rainfall files (such as radar and multi-sensor data files).
Rain gauge data may be loaded from a tab delimited text file, using the Design storm option. If data from several rain gauges is used (employing the Interpolated gauge option), a tab delimited text file as well as a point shapefile of rain gauge locations are required. Radar and other multi-sensor rainfall files may be loaded as New rainfall files in any of the following formats: ASCII, CSV, UF, and Level II.
Detailed instructions for each Rainfall Wizard option are included below.
Existing RRP files
RRP, or rainfall rate properties files, bear the file extension: *.rrp. RRP files are used in Vflo™ to save rainfall event data. Once rain gauge, radar, and/or multi-sensor rainfall data has been loaded to Vflo™ using one of the methods described below, the rainfall event data can be saved in a single RRP file for efficient re-load. RRP files are compressed files, and are thus faster to load. See Saving rainfall data for instructions on saving RRP files.
Step-by-step instructions for opening an existing RRP file
1. Open the Rainfall Wizard.
- Select Precipitation | Load Precipitation.
2. In the Rainfall Wizard dialog, select Existing RRP File.
- Then, click Browse.
3. In the Load RRP File window, navigate to the RRP file, then click Open.
Design storm
The Design Storm option establishes spatially uniform rainfall. The Design Storm option should be used both for producing a synthetic distribution based on the SCS Type I, Type IA, Type II, or Type III design storm distribution, and for loading data from a single rain gauge.
There are three options for producing a design storm/loading rainfall data from a single rain gauge.
- 1. Loading a tab delimited text file.
- 2. Manually entering rainfall values into Vflo™.
- 3. Specifying Type, Depth, and Durationfor an SCS type storm.
Importing a file for a single rain gauge or design storm
Formatting single rain gauge and design storm files
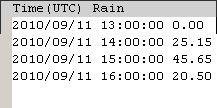
Use a tab delimited text file with two columns, as shown in the example below. The first column must contain date/time, in the format: YYYY/MM/DD HH:MM:SS. Note that a space must separate each date (YYYY/MM/DD) from each time (HH:MM:SS). The second column must contain rainfall values. Rainfall values may be in units of rate or accumulation. Possible rate units include: inches/hour, centimeters/hour, millimeters/hour. Possible accumulation units include: inches, centimeters, millimeters. It is not necessary to specify what rainfall units are used within the text file, as the units will be specified within the Design Storm dialog.
Include a header row containing two text strings, separated by a tab. The first text string may be "Date", "Time", "date", "time", "date/time", "time/date", "Time(UTC)", "Time(CST)", etc. The second text string may be "Rain", "Precip", etc. File data is read when the program recognizes a line beginning with the text "Time" or "Date"; thus, notes may be inserted above the header row, if desired, without interrupting the program process.
The sample file below contains rainfall rate data for a single rain gauge. Values given are for demonstration purposes only.
Step-by-step instructions for importing a single rain gauge or design storm file
1. Select the cells for which the rainfall data is to be applied.
- If it is desired to load precipitation for only specific cells, then select the desired cells before proceeding. If it is desired to apply the rainfall data to the entire Vflo™ domain, then be sure that one cell or no cells are selected before proceeding.
2. Open the Rainfall Wizard.
- Click on the Load precipitation
 tool in the Vflo™ Toolbar, or select Precipitation | Load Precipitation.
3. Choose the Design Storm option.
- Then, click Next.
4. Choose the From File option.
- Then, click the Browse button. In the Load Rainfall window, browse to the tab delimited text file and select Open. The text file must be formatted as described above. Once a file has been selected, the file address will appear beside the Browse button, and the hyetograph will display the values of the uploaded file. (Note that the Time of First File, Duration, and Interval fields located above the hyetograph, as well as the Rain Samples list located beside the hyetograph, do not reflect file values.)
5. Choose the units of the file.
- On the left side of the window, unit choices are listed. If data consists of rainfall rates, choose either: Inches / Hour, Centimeters / Hour, or Millimeters / Hour. If data consists of rainfall accumulation, choose either: Inches, Centimeters, or Millimeters. The units chosen will be displayed in the hyetograph.
6. Click Finish.
- The result will be spatially uniform rainfall that varies in time.
7. Save the rainfall data as a RRP file.
Manually entering single rain gauge and design storm data
If a rainfall file is not available, then rain gauge (or design storm) values may be manually entered.
Step-by-step instructions
1. Select the cells for which the rainfall data is to be applied.
- If it is desired to load precipitation for only specific cells, then select the desired cells before proceeding. If it is desired to apply the rainfall data to the entire Vflo™ domain, then be sure that one cell or no cells are selected before proceeding.
2. Open the Rainfall Wizard.
- Click on the Load precipitation tool in the Vflo™ Toolbar, or select Precipitation | Load Precipitation.
3. Choose the Design Storm option.
- Then, click Next.
4. Choose the Manual option.
5. Choose the appropriate units.
- Unit selections are located on the left side of the Design Storm window.
6. Enter the Time of First File, Duration, and Interval in the fields provided.
- Time of First File should be entered in the format: YYYY/MM/DD HH:MM. Note that a space is inserted between the date (YYYY/MM/DD) and the time (HH:MM). Duration should be entered in hours, and Interval should be entered in minutes.
7. Enter rain values in the provided Rain Samples fields.
- Values must be entered in the units selected in Step 5, above. To enter a rain value, double click in the field so that a cursor appears, then type in values. By default, only two Rain Samples fields are shown. To add rain values to the Rain Samples list, click the Add button. To delete a rain value from the list, select the value by clicking on it, then click the Remove button.
- Duration and Interval values will be automatically adjusted as Rain Samples values are added and deleted. The hyetograph will display the listed values.
8. Click Finish.
9. Save the rainfall data as a RRP file.
Generating a SCS type design storm
Step-by-step instructions
1. Open the Rainfall Wizard.
- Click on the Load precipitation tool in the Vflo™ Toolbar, or select Precipitation | Load Precipitation.
2. Choose the Design Storm option.
- Then, click Next.
3. Select SCS, then choose Type, SCS Depth, and SCS Duration.
- From the drop down menu provided, select the SCS Design Storm Type from the following options: Type I, Type IA, Type II, Type III.
- In the SCS Depth field, enter the desired total rainfall depth for the SCS design storm. Depth must be entered in either inches, centimeters, or millimeters.
- In the SCS Duration field, enter the design storm duration in hours. The hyetograph display will change as SCS specifications are entered, to demonstrate the resulting design storm hyetograph.
4. Choose the appropriate units.
- Select either Inches, Centimeters, or Millimeters from the left-hand side of the window.
5. Click Finish.
6. Save the rainfall data as a RRP file.
Interpolated gauge
Interpolation of rainfall maps from gauge locations may be accomplished in Vflo™ by specifying the location of each gauge and providing hyetograph data for the gauges. As described below, two files are required for rain gauge interpolation:
- A point shapefile that defines the location of each gauge with a unique ID, in the same projection as the Vflo™ domain
- An ID Series or a Time Series file containing hyetograph data for each gauge ID. Either a comma delimited text file or a tab delimited text file is acceptable.
Interpolation is calculated by weighting schemes which grant a gauge decreasing influence as distance from that gauge's cell location increases. Two spatial distribution methods are available: exponential weighting or inverse distance weighting.
Formatting interpolated gauge files
Use either a comma delimited text file or a tab delimited text file.
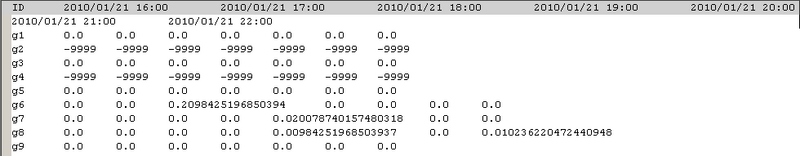
For ID Series, include a header line that begins with the text "ID", followed by time entries in the format: YYYY/MM/DD HH:MM. (For example, the header line of a tab delimited text file will be of the format: ID time1 time2 time3 time4...etc.) Note that there must be a space between each date (YYYY/MM/DD) and time (HH:MM). Begin subsequent lines with a unique gauge ID, followed by rainfall values for the corresponding times. (For example, lines of a tab delimited text file will be of the format: gaugeID1 time1value time2value time3value time4value...etc.) In the example below, gauges have been given the IDs: g1, g2, g3, etc.
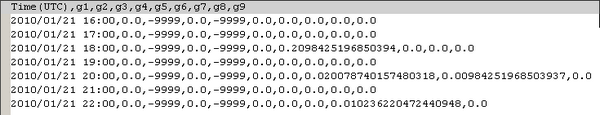
For Time Series, include a header line that begins with the text Time, followed by the unique gauge IDs assigned for each rain gauge. (For example, the header line of a comma delimited text file will be of the format: Time,gaugeID1,gaugeID2,gaugeID3,gaugeID4,...etc.) Begin subsequent lines with a time in the format YYYY/MM/DD HH:MM, followed by rainfall values for the corresponding gauges. (For example, lines of a comma delimited text file will be of the format: YYYY/MM/DD HH:MM,gauge1value,gauge2value,gauge3value,gauge4value...etc.) To demonstrate that either a comma delimited or a tab delimited text file, and either an ID Series or a Time Series may be used, the example below shows the same data as used above, but in a comma delimited Time Series format.
Step-by-step instructions for Interpolated gauge
1. Open the Rainfall Wizard.
- Click on the Load precipitation tool in the Vflo™ Toolbar, or select Precipitation | Load Precipitation.
2. Choose the Interpolated Gauge option.
- This option results in spatially distributed rainfall created from more than one rain gauge hyetograph.
3. Load the Rain Gauge Locations shapefile.
- Click the Browse button located under the text Rain Gauge Locations (Point Shapefile). In the Choose Shapefile dialog, select the shapefile and click Open. Then, select the field containing the unique gauge IDs from the Select ID Field drop down menu. Finally, click Load.
- As described above, the shapefile must define the location of each gauge with a unique ID, and be in the same projection as the Vflo™ base parameter maps.
4. Load the Rainfall Data file.
- Rainfall data files must be formatted according to the specifications above.
- Select the file type: either ID Series or Time Series. Enter the Year of the rainfall data provided; this is necessary because the file name does not bear a timestamp. Click Browse. In the Choose Data File dialog, select the file and click Open. Finally, specify whether data is in Inches or Millimeters.
5. Choose the Spatial Distribution Method.
- Two methods are supported: Exponential Weighting or Inverse Distance Weighting.
6. Click Finish.
- The result will be spatially distributed rainfall created from multiple rain gauge hyetographs.
7. Save the rainfall data as a RRP file.
New rainfall files
The New Rainfall Files option supports entry of gridded rainfall data from spatially variable rainfall files. The following file types are supported: ASCII, CSV, UF, Level II, and DPR. See below for formatting instructions for each file type.
Formatting ASCII rainfall files
ASCII files may contain either rainfall rate or accumulation data from any source. If rate is used, file names should be a timestamp of the date and time at which the rainfall rates occurred, in the format: yyyymmddhhmm.asc. Rainfall rates occuring between the given instantaneous rates will be calculated by linear interpolation between the given instantaneous rates. If accumulation data is used, file names should be a timestamp of the end time of the rainfall accumulation, in the format: yyyymmddhhmm.asc. For example, the list of filenames below would contain rain accumulation data for a section of a storm event from 1:07 AM on August 15, 2010 to 2:37 AM on August 15, 2010 (files are for 15-minute intervals):
201008150122.asc
201008150137.asc
201008150152.asc
201008150207.asc
201008150222.asc
201008150237.asc
ASCII rainfall files must be in ESRI ASCII grid format. Files must contain 6 header rows, as demonstrated by the example at right. ASCII file headers describe the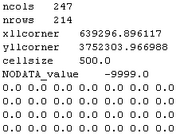 number of columns ("ncols"), the number of rows ("nrows"), the lower left x-coordinate ("xllcorner"), the lower left y-coordinate ("yllcorner"), and the resolution ("cellsize"). Starting in Vflo™ version 5.1, this information (combined with associated coordinate system information, as well as the coordinate system of the Vflo™ domain) will be used to sample the input data into the shape of the Vflo™ domain. In previous versions of Vflo™, the grid definition of the rainfall files must be the same as the Vflo™ model. Thus, if GIS parameter maps were used to construct the Vflo™ model, then the ASCII rainfall files should have the same header values as the ASCII parameter maps.
In the example provided at right, there are 247 columns and 214 rows of data. The xllcorner and yllcorner values shown are the geographic projection coordinates of the lower left corner of the model domain. The cell size, or resolution, is 500 meters. Finally, the NODATA value, or null value, is defined as -9999. Each value in the gridded data array of 247 columns by 214 rows is the amount of rainfall that accumulated from the time of the previous file, to the end time of accumulation represented by the file name.
Rainfall rate data may be in units of Inches/Hour, Centimeters/Hour, or Millimeters/Hour. Rain accumulation data may be in units of Inches, Centimeters, or Millimeters. Units do not need to be indicated within the file, as units will be specified in the Rainfall Wizard dialog. Similarly, the time zone of the time times specified by the file names, necessary to relate this data to other timed data, will be specified as a step in the Rainfall Wizard dialog.
Formatting CSV rainfall files
CSV (*.csv), or comma separated values files, may be used to load rainfall data to Vflo™. Files may contain either rain rates or accumulation. As described above, 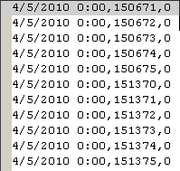 rate file names should be a timestamp of the date and time at which the rainfall rates occurred, and accumulation file names should be a timestamp of the end date/time of the accumulation, in the format: yyyymmddhhmm.asc. File contents must be in the format: YYYY/MM/DD HH:MM:SS,ID,value.
To be loaded into the Vflo™ domain, the values in these files must be associated with geographic shapes, to indicate where the values should be applied. This is done by associating the CSV files with an ESRI Shapefile to represent the bounds of each input ID. When loading CSV files, a corresponding Shapefile must also be sekected. Generally, the relationship between the two is established by select which field in the Shapefile's associated DBF Database corresponds to the ID column in the CSV files. The CSV files and the Shapefile may also be related not by choosing an ID, but by preparing the CSV files such the values are presented in the same order as the individual shapes are stored in the Shapefile (record order); this may be indicated by selecting the radio button for Use shape order on the Choose Shapefile dialog after loading the files.
The example at right contains rainfall rate data for shapes with the IDs 150671, 150672, 150673, 150674, 150675, 151370, 151371, 151372, 151373, 151374, and 151375 at midnight on April 5, 2010.
Rainfall rate data may be in units of Inches/Hour, Centimeters/Hour, or Millimeters/Hour. Rain accumulation data may be in units of Inches, Centimeters, or Millimeters. Units do not need to be indicated within the file, as units will be specified in the Rainfall Wizard dialog. Similarly, the time zone of the time times specified by the files, necessary to relate this data to other timed data, will be specified as a step in the Rainfall Wizard dialog.
UF and Level II file formats
Universal Format (UF) and Level II are the two radar file formats supported by Vflo™. Universal Format is a common radar data format developed by the University Corporation for Atmospheric Research (UCAR). A typical UF format filename is: XXX_XXX_200407030000.uf, in which 200407030000 is a timestamp in the format: YYYYMMDDHHMM. Unless conversion has been made, the file name timestamp is usually in UTC time.
Level II data is compressed and normally has a “.z” extension, such as: 6500XXXX20060712_000458.z, where 6500 is the product number generated by the NEXRAD (WSR-88D) radar, XXXX is the radar name, 20060712 is the timestamp date in YYYYMMDD format, and 000458 is the timestamp time in HHMMSS format. This time information is also contained within the files themselves; when reading the file, this internal time information is used. Each radar file represents a volume scan of the radar, and contains reflectivity that will be processed by Vflo™ to produce rainfall accumulation data. In constrast to ASCII and CSV files described above, these radar formats contain sufficient information to reference their data spatially; no Shapefile, filter file, or other intermediate spatial referencing is required to relate this input data with the Vflo™ domain.
Digital Precipitation Rate format
Digital precipitation rate (DPR) format is a Level III radar product created by the National Weather Service that estimates rainfall rates based on dual-pol radar reflectivity variables. DPR data can be ordered from the National Climatic Data Center at the NCDC NEXRAD Data Inventory Search Engine. Individual radars can be selected by clicking on the map or through the dropdown box below the map of the United States. After selecting an individual radar, a list of products available for the NEXRAD site will be displayed. The DPR product can be found by entering "DPR" under the product filter. After entering a date and clicking on the Create Graph button, the user can see which DPR is available for a specific NEXRAD site.
After you have ordered the data the NCDC will send an email providing a link to the data. The NCDC will allow the user to download files using FTP or HTTP protocols. If downloading using FTP ensure that the files are downloaded using the Binary transfer mode. The files downloaded from NCDC do not have a file extension. The data can be loaded into Vflo using the steps below for loading rainfall using the Rainfall Wizard. When selecting the DPR files using the Add Rainfall Files dialog, you will need to set the drop down for Files of Type "All Files". This is due to the DPR data not having a file extension.
Keep in mind that radar data alone, without adjustment with rain gauges, may not produce satisfactory results if matching actual streamflow hydrographs is desired. Vieux & Associates, Inc. offers services to rain gauge correct and format radar data for use in Vflo™ and other hydrologic applications.
In the Rainfall Wizard dialog described below, a Z-R relationship appropriate for the data will be selected to convert reflectivity observations to rainfall rates. It is not necessary to specify the time zone of the times contained in these files; these formats are unambiguous in this way.
Step-by-step instructions for loading New rainfall files
1. Open the Rainfall Wizard.
- Click on the Load precipitation tool in the Vflo™ Toolbar, or select Precipitation | Load Precipitation.
2. Choose the New Rainfall Files option.
- Then, click Next.
3. Click the Add Files button (represented by a page with a plus sign) to load rainfall files.
- In the Add Rainfall Files dialog, navigate to the rainfall files directory and select all rainfall files to be loaded. To select multiple files at once, hold the SHIFT key while selecting files. Then, click Open. A small delay may occur as Vflo™ inspects the selected files to determine their file type. The types of the files are displayed as well as their names. Only one type of file may be loaded at once.
4. Arrange files to be in chronological order.
- Use the Move File Up, Move File Down, and Remove Files buttons to change the order of the rainfall files, or to remove any unnecessary files.Once files are in chronological order, click Next.
5. Specify the shape of the input domain, or input coordinate system (optional).
- If it is not possible to determine the shape of the rainfall input domain from the files (such as CSV files), or if it is possible to determine the shape of the input but not the coordinate system (such as ASCII files), the next step in the wizard is to specify this information. This step may not always occur, for instance in the case of Level II files, which contain all the information necessary to relate their data spatially to the Vflo™ domain.:To specify the shape of the rainfall input domain, choose Regular Grid, Radial Grid, or Shapefile.
- Regular grid refers to a rectangular grid made of of square cells. Radial grid refers to a circular domain divided into wedge shaped cells, such as a radar grid. To specify other shapes, include subsets of such domains or irregular grid shapes, it is necessary to use a Shapefile.
- All options for specifying the rainfall input shape should include a coordinate system specification as well; should either the input domain or the Vflo™ domain not have associated coordinate system information, an option is presented to assume that the coordinate systems are the same.
- When selecting a Shapefile as the shape of the rainfall input domain, either select a column from the Shapefile's associated DBF database file to correspond to the IDs in the rainfall input files, or specify that the input files contain values in the same order as the shapefile specifies shapes.
- If a BAG filter file (*.bag) already exists for relating the rainfall input domain to the Vflo™ domain, it can be loaded by selecting Load saved filter file instead of Specify Shape. Such a filter file may have been created using an older version of Vflo™ or other software.
- For some file types, only a coordinate system is required. Select Choose to specify the Input Coordinate System.
6. Select the Units and Time zone used in the rainfall files.
- Instantaneous options include: Inches / Hour, Centimeters / Hour, or Millimeters / Hour.
- Accumulation options include: Inches, Centimeters, or Millimeters.
- For radar files, an appropriate Z-R relationship must be chosen. Z-R options include: dBZ Convective (300, 1.4), dBZ Tropical (250, 1.2), dBZ Warm Stratiform (200, 1.6), and dBZ Cool Stratiform (130, 2.0). If a Z-R relationship other than those listed is to be used, select Other dBZ and enter the appropriate A and B values in the fields provided.
- If files to not contain time zone information, operate the searcable Input Time Zone: drop down menu to select the time zone from the Olson time zone database.
7. Click Finish.
- The rainfall files will now be loaded into Vflo™. This may take a few seconds to several minutes, depending on how many files are loaded and their resolution. Once loaded, select the Precipitation panel to view the rainfall model at each cell.
8. Save the rainfall data as a RRP file.
- RRP files store data already filtered into the shape of the associated Vflo™ domain, obviating the need for this complicated process. To use this data in the future, store it as a RRP file so that Loading the RRP file is the only step necessary to re-load rainfall event data.
Saving rainfall data
Saving rainfall event data as a single RRP (*.rrp) file allows for efficient re-loading of precipitation data. For information about saving hyetograph data for a single cell, see Exporting hyetographs.
Step-by-step instructions for saving rainfall data as a RRP file
1. Once rainfall data has been loaded, select Precipitation | Save RRP File.
- Alternatively, select the Save precipitation
 tool from the Vflo™ Toolbar.
2. In the Save RRP File window, select a Save in location and enter a File name, then click Save.
3. See Existing RRP files for information on opening saved RRP files.
Viewing hyetographs
Once rainfall files have been loaded, hyetographs are available for viewing and export. The step-by-step instructions below are for viewing a cell hyetograph. To view a network average hyetograph, use Network analysis. For information on exporting hyetograph data, see Exporting hyetographs.
Step-by-step instructions
1. Select the cell for which a hyetograph is desired.![]()
2. Open the Precipitationpanel to view the cell hyetograph.
- After loading rainfall data, the Precipitation panel will appear. The Precipitation panel is located at the bottom of the Cell Properties pane, on the right side of the Vflo™ interface. To open the Precipitation panel, click on the Precipitation tab, as shown at right.
3. To view the hyetograph in a separate window, click the Expand ![]() button.
button.
Viewing rainfall animations
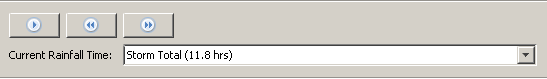
Once rainfall is loaded to Vflo™, the Rainfall Animation Control panel, shown below, will appear beneath the Main Display. This panel contains the tools for starting, stopping, and pausing rainfall animations.
Step-by-step instructions
1. Check to see that the Rainfall Animation Control panel is visible.
- The Rainfall Animation Control panel is visible only if rainfall has been loaded to Vflo™, and if rainfall is currently shown in the Main Display. To load rainfall, see the instructions above. To display rainfall, first make sure that the Background Layer box is checked in the Layers list. Then, click the Background Layer tab, and select either Rainfall or Rainfall and Background Image from the drop down menu.
2. To initiate a continuous rainfall animation, click the Play animation ![]() button.
button.
- The time of each rain image will be indicated in the Current Rainfall Time field.
3. To stop a continuous rainfall animation, click the Pause animation ![]() button.
button.
4. To select a particular rainfall time to view, select the time from the Current Rainfall Time drop down menu.
5. To view previous/subsequent rainfall times, use the Previous Frame ![]() and Next Frame
and Next Frame ![]() buttons.
buttons.
Exporting rainfall data
For information on exporting cell hyetographs, see Exporting hyetographs.
For information on exporting a storm total map of distributed rainfall accumulations, see Exporting a storm total map.