Getting around Vflo™
The Vflo™ interface is designed to facilitate efficient hydrologic modeling. Use this guide as an introduction to the key menus, panes, and panels of the Vflo™ interface.
There are seven key components of the Vflo™ interface, as numbered in the image below.
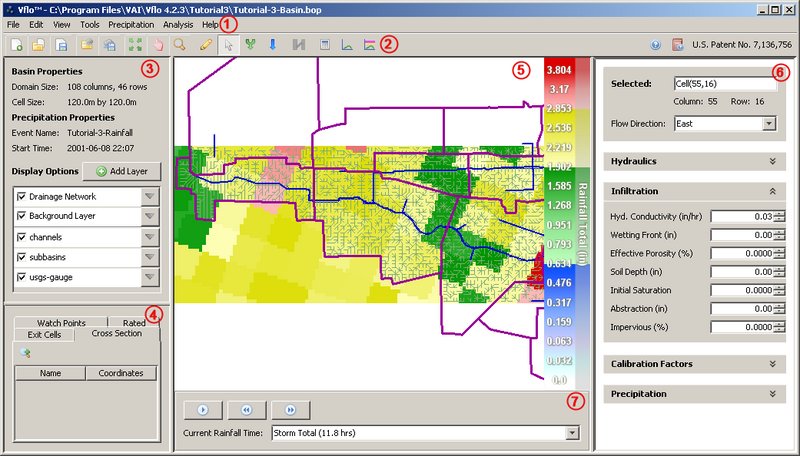
1. Main Menu
- The Main Menu offers the key functions needed to set up and run a Vflo™ model, as well as to export data and seek Help for questions. Menus include: File, Edit, View, Tools, Precipitation, Analysis, and Help.
2. Vflo™ Toolbar
- The Vflo™ Toolbar features tools for opening and saving BOP files, loading and saving precipitation files, zooming and panning, selecting cells, conducting Network Analysis, and solving Vflo™. These tools serve as shortcuts for performing these key Vflo™ functions. The tools of the Vflo™ Toolbar are described below.
3. Display Options Pane
- On the top left of the Vflo™ interface is the Display Options pane. Use the Display Options Pane to control the appearance of the Main Display (see Changing the Vflo™ display for details).
4. Cell List Pane
- On the bottom left of the Vflo™ interface, the Cell List Pane includes lists of specialized cells. Exit Cells, Cross Section cells, Rated channel cells, Watch Points, and Observed cells are listed, to facilitate identification and location of important cells.
5. Main Display
- Located in the center of the Vflo™ interface, the Main Display illustrates the basin domain, cell connections, background image, color-graded parameter maps, and any shapefiles that have been loaded to the Vflo™ model. When a parameter map is displayed (e.g., rainfall, roughness, slope, etc.), a color scale will appear at the right side of the Main Display. In the image above, a rainfall map is displayed, and so a rainfall total color scale appears in the Main Display. The layers displayed will vary, depending on whether the user has toggled layers on or off in the Display Options pane. For further explanation, see Changing the Vflo™ display.
6. Cell Properties Pane
- The Cell Properties Pane makes up the right side of the Vflo™ interface and conveys key information about the parameters of the selected cell. At the top of the Cell Properties pane, the Selected Cell Panel presents the name, coordinates, and flow direction of the selected cell. The Hydraulics panel contains information about Cell Type and hydraulic properties. The Infiltration panel contains information on infiltration parameters for the cell, like hydraulic conductivity and effective porosity. The Calibration Factors panel indicates what calibration factors have been applied to the selected cell. Finally, the Precipitation panel contains the hyetograph of the selected cell. For more information on each panel, see Using the Cell Properties pane below.
7. Rainfall Animation Control Panel
The Rainfall Animation Control Panel features animation controls to play, pause, and select specific animation frames in an animation sequence of rainfall files. The Rainfall Animation Control panel appears only when precipitation files have been loaded to Vflo™ and when rainfall is displayed in the Main Display.
Contents
The side panels of the Vflo™ interface are adjustable to accommodate different platforms and user preferences. To adjust the size of the Display Options pane, the Cell List pane, or the Cell Properties pane, place the cursor over the pane's edge. When the cursor turns into a black arrow, click and drag to the right or left (or up and down) as needed.
The sequence of images below demonstrates this process, using the Cell List pane as an example. In the first image, the white, Selection cursor rests within the Cell List pane. In the second image, the cursor has been moved so that it rests directly over the pane's edge. This has caused the Selection ![]() cursor to turn into a black arrow. In the third image, you see that the user has clicked and dragged the edge of the Cell List pane to the right, so that a black line appears where the new edge will be. The fourth image shows the expanded Cell List pane.
cursor to turn into a black arrow. In the third image, you see that the user has clicked and dragged the edge of the Cell List pane to the right, so that a black line appears where the new edge will be. The fourth image shows the expanded Cell List pane.

When the panes are expanded, portions of the Main Display may be hidden. Likewise, portions of the side panes may be obscured if the Main Display or neighboring panes are expanded. After loading a BOP file, be sure to adjust the side panes so that all important features are visible and accessible. Vflo™ will store pane positioning as a user setting, so that the next time Vflo™ is opened, side panes will appear at the same width and height as when Vflo™ was last used.
Using the Vflo™ Toolbar
The tools of the Vflo™ Toolbar provide shortcuts for performing key Vflo™ functions, as described below.
 : The Create a new file tool...
 : The Open tool allows BOP files (*.bop, *.bopx) to be loaded. This tool is one of the first a user may select upon opening Vflo™, to load a basin model.
 : The Save tool saves BOP files (*.bop, *.bopx).
 : The Load precipitation tool opens the Rainfall Wizard, used to load precipitation files.
 : The Save precipitation tool saves RRP (*.rrp), Rainfall Rate Properties files.
 : The Show extent tool zooms to the extent of the Vflo™ domain, as described in Zooming to basin extent.
 : The Pan tool may be used to move the basin image within the Main Display. The Pan tool acts as a cursor, as described in Panning.
 : The Zoom tool is used to zoom in and zoom out of the Main Display, as described below.
 : The Draw cell connections tool is used to edit cell flow direction, as described in these Step-by-step instructions.
 : The Selection tool may be used to select single cells or groups of cells, as described in Selecting cells.
-
 : The Select upstream cells tool selects all cells upstream of an output cell, as described in these Step-by-step instructions.
 : The Select upstream channel cells tool selects only the channel cells upstream of an output cell, as described in these Step-by-step instructions.
 : The Select upstream overland cells tool selects only the overland cells upstream of an output cell, as described here.
 : The Set baseflow tool is used to establish baseflow across a channel reach. For further information, see Entering baseflow.
 : The Network Statistics tool brings up the Network Statistics window, which displays key parameter statistics for the selected drainage network, as well as a basin average hydrograph.
 : The Analyze Cell tool solves Vflo™ at the selected cell.
 : The Analyze Basin tool solves Vflo™ at each established watch point.
 : Located on the far right of the Vflo™ Toolbar, the Help tool connects the user to the Vflo™ Online User Guide.
 : Also located on the far right of the Vflo™ Toolbar, the Tutorial tool connects the user to a list of featured tutorials, useful for learning the fundamental processes of Vflo™.
Using the Cell Properties pane
The Cell Properties pane contains cell-specific information for the selected cell. Each panel within the Cell Properties pane is described below. For detailed information about using the Vflo™ panels to change parameters, see Editing cell properties.
Selected Cell panel
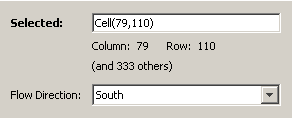
The Selected Cell panel reports basic information about the cell(s) selected. The Selected field shows the name of the selected cell. In the example provided at right, the cell bears its default name: Cell(79,110).
Underneath the Selected field, the coordinates of the selected cell are indicated. If more than one cell is selected, the additional number of cells is stated. In the example at right, Cell(79,110) and 333 others have been selected. It is important to note that parameter values and graphs shown in the other modules reflect values only for the primary selected cell, as explained in Editing cell properties.
Finally, the Selected Cell panel reports the flow direction of the selected cell.
Hydraulics panel
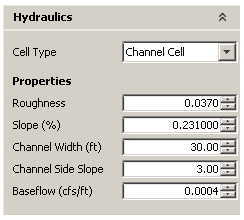
The Hydraulics panel reports Cell Type as well as cell Properties, as shown at right. For detailed information on cell types, see the Cell types page. For detailed information on hydraulic properties, see the Hydraulic properties page.
Infiltration panel
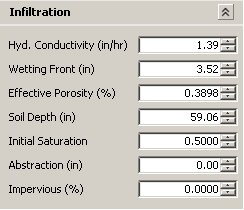
The Infiltration panel reports values for infiltration properties including: Green and Ampt parameters (hydraulic conductivity, wetting front, effective porosity), soil depth, initial saturation, abstraction, and impervious.
Calibration Factors panel
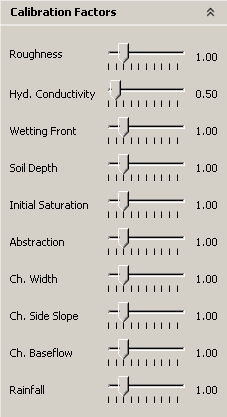
The Calibration Factors panel features slider bars that are used to apply calibration factors to parameter values. For further information see Using the Calibration Factors panel.
Precipitation panel
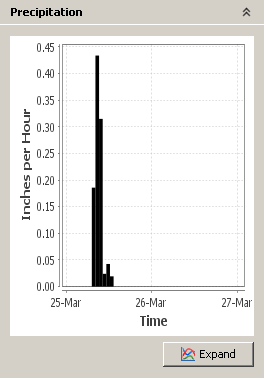
The Precipitation panel includes the hyetograph for the selected cell. The Precipitation panel is visible only after rainfall files have been imported to Vflo™.
Zooming
There are several methods for zooming in and out of the Vflo™ Main Display, described below.
Using the Zoom tool
Keep in mind that when using the Zoom ![]() tool, regardless of where the user clicks, zoom will be toward the center point of the Main Display. To zoom to a specific area of the Main Display, draw a zoom box, or pan to the specific area before using the Zoom
tool, regardless of where the user clicks, zoom will be toward the center point of the Main Display. To zoom to a specific area of the Main Display, draw a zoom box, or pan to the specific area before using the Zoom ![]() tool.
tool.
Step-by-step instructions
1. Select the Zoom ![]() tool from the Vflo™ Toolbar, or select Edit | Zoom.
tool from the Vflo™ Toolbar, or select Edit | Zoom.
- The Zoom
 cursor will become active.
2. To zoom in, left click anywhere within the Main Display.
Using the mouse wheel
The mouse wheel can be used to zoom in and out at any time, regardless of the tool selected, so long as the Main Display is the active panel. If the user is working within another panel, such as the Modules panel, then rolling the mouse wheel will have no effect.
As with the Zoom tool, zoom will be toward (or away from) the center point of the Main Display.
Step-by-step instructions
1. Activate the Main Display panel.
- Click anywhere within the Main Display.
2. To zoom in, roll the mouse wheel forward.
3. To zoom out, roll the mouse wheel backward.
Drawing a zoom box
Drawing a zoom box is an efficient means of zooming to a user-specified area.
Step-by-step instructions
1. Select the Zoom ![]() tool from the Vflo™ Toolbar.
tool from the Vflo™ Toolbar.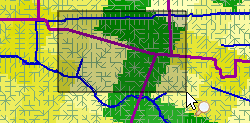
- The Zoom cursor will become active.
2. Click and drag the mouse to draw a rectangular box around the area to which zoom is desired.
- When the mouse is released, the Main Display will be zoomed in to display only the selected rectangular area.
Zooming to specialized cells
All watch points, rated channel cells, exit cells, and cross section cells are listed in the Specialized Cells panel, located on the lower left of the Vflo™ interface. The Zoom to cell ![]() tool of the Specialized Cells Panel is useful to zoom to a specific cell that is a focus of analysis or model setup and calibration, such as a specific watch point cell.
tool of the Specialized Cells Panel is useful to zoom to a specific cell that is a focus of analysis or model setup and calibration, such as a specific watch point cell.
Step-by-step instructions
1. Open the appropriate specialized cell list.
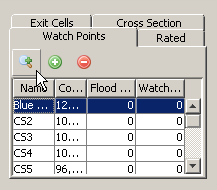
- For example, click on the Watch Points tab to open a list of cells established as watch points.
2. Click on the desired cell name in the list.
- The cell name will be highlighted in blue.
3. Select the Zoom to cell ![]() tool.
tool.
- The cell will be selected, and the Main Display will zoom to the area surrounding the cell.
Zooming to a specific cell or coordinates
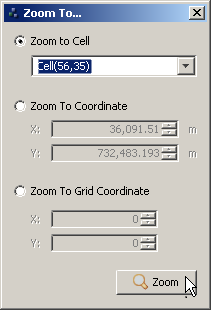
Select View | Zoom To... to zoom to a specific cell, specific coordinates (as established by the coordinate system of the Vflo™ model), or specific Vflo™ grid coordinates, as shown at right.
Zooming to basin extent
Click the Show extent ![]() tool to zoom out (or in) to the extent of the Vflo™ domain.
tool to zoom out (or in) to the extent of the Vflo™ domain.
Panning
Step-by-step instructions
1. Select the Pan ![]() tool from the Vflo™ Toolbar, or select Edit | Pan.
tool from the Vflo™ Toolbar, or select Edit | Pan.
2. Click and drag the mouse within the Main Display to pan the basin image in any direction.
Selecting cells
For information on selecting cells in Vflo™, see Selecting cells.