Tutorial: Establishing rated channel cells and loading rating curves
This tutorial demonstrates the process of loading rating curves and adjusting Green & Ampt infiltration parameters. Model simulation for a moderately sized basin of 460 mi2 (1200 km2), the Blue River basin, is demonstrated. The Blue River basin is located in Oklahoma, and is the subject of a number of studies including the Distributed Model Intercomparison Project organized by the US National Weather Service.
Contents
Preparing Vflo™
1. Select File | Open to open an existing Vflo™ model (BOPX file).
- To open a Vflo™ model, the Open
 tool of the Vflo™ Toolbar may also be used, or the shortcut key CTRL + O.
 - Navigate to the file Tutorial4\Blue_River_Basin.bopx. Click Open.
2. Open the Watch Points list.
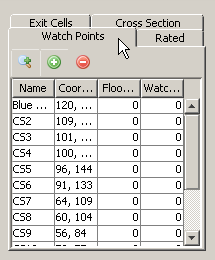
- Find the Cell List pane, located on the lower left of the Vflo™ interface. Click the Watch Points tab. Watch point cells named CS1, CS2, and on through CS14 are listed. Each watch point represents a rated channel cell, where channel measurements are known. The measurements allow for rating curves to be imported into Vflo™ at each watch point. In Vflo™, channel cells for which rating curves are available may be made into rated channel cells. (Similarly, channel cells for which cross sections are available may be changed to cross section cells.)
3. Compare rated channel cells to channel cells.

- Select CS4 from the list of watch points. Click on the Zoom
 button to select and zoom to the cell.
4. Open the Hydraulics panel.
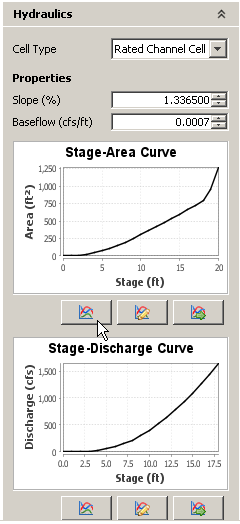
- As is evident by the Cell Type field, cell CS4 is a rated channel cell. Observe the two rating curves at the bottom of the module window. To view a larger graph of either rating curve, click on the Show curve
 tool located beneath the curve.
5. Now, zoom to the watch point cell named Blue River/CS1.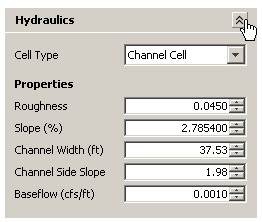
- Open the Hydraulics module and look at the Cell Type field. This cell is established as a channel cell, not as a rated channel cell, and thus no rating curves are shown in the Hydraulics panel. As rating curve data is available, the cell will be changed to a rated channel cell and rating curves will be loaded.
Establishing rated channel cells
1. With cell Blue River/CS1 selected, open the Hydraulics panel.
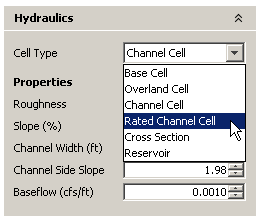
- In the Hydraulics panel, click on the Cell Type drop down menu, and select Rated Channel Cell. A Stage-Area Curve and a Stage-Discharge Curve will appear in the Hydraulics panel. The curves, however, will be straight lines. The two rating curves need to be edited.
- Click on the Edit curve
 tool located beneath the Stage-Area Curve.
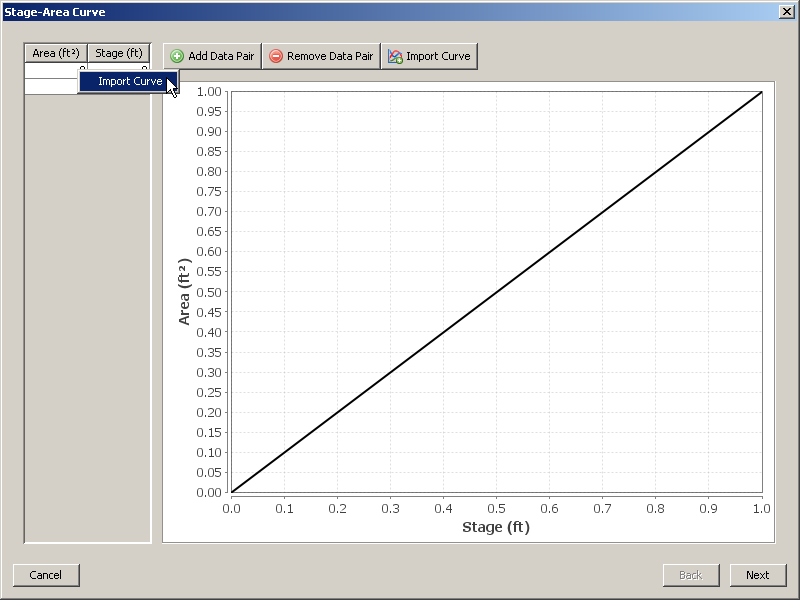
- In the Stage-Area Curve window (shown below), a data table is located at the top left. To import the rating curve data, right click on the table and select Import Curve, or select the Import Curve
 tool located above the rating curve. Navigate to the file Tutorial4\english\CS01AreaStage_english.txt (or Tutorial4/metric/CS01AreaStage_metric.txt, as appropriate) and select Open. Rating curve data files need to be in required formats for import to Vflo™. For a description of file requirements, see Preparing rating curve and cross section data files.
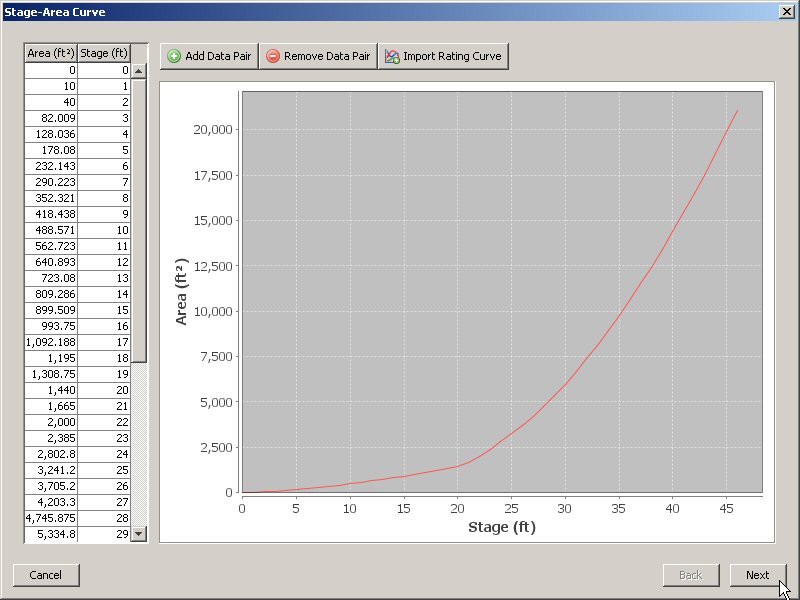
3. The Stage-Area Curve will be populated with data values, as shown below.
- Click Next to return to the main screen.
4. Load the Stage-Discharge Curve.
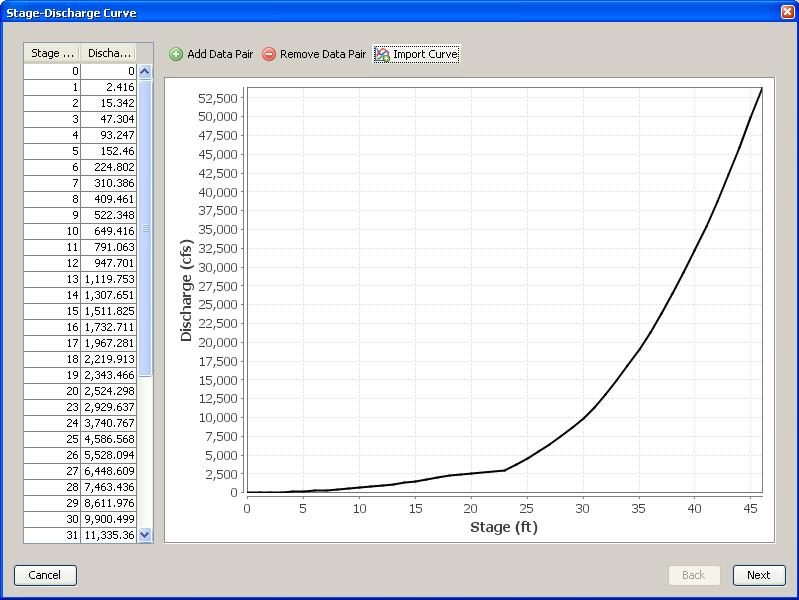
- Repeat steps 2-3 for the Stage-Discharge Curve. In the Hydraulics panel, click on the Edit curve above tool located beneath the Stage-Discharge Curve. In the Stage-Discharge Curve window, select the Import Curve tool and navigate to the file located at Tutorial4\english\CS01StageFlow_english (or Tutorial4\metric\CS01StageFlow_metric, as appropriate). Click Open. The Stage-Discharge Curve will be populated with data values, as shown below. Click Next to return to the main screen.
5. Observe the Hydraulics panel after importing the rating curves.
- The module now shows edited Stage-Area and Stage-Discharge curves for the cell Blue River/CS1. These rating curves will be used to calculate the hydraulics of cell Blue River/CS1, in place of the channel width and channel side slope values used when Blue River/CS1 was defined as a basic (trapezoidal) channel cell.
Editing infiltration values
1. Load rainfall for Event 1.
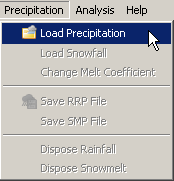
- Two rainfall events (Event_1_Rain.rrp and Event_2_Rain.rrp) with corresponding observed data at the Blue River/CS1 watch point are included in the Tutorial4 file. To load the Event 1 precipitation data, select Precipitation | Load Precipitation. (The Load precipitation
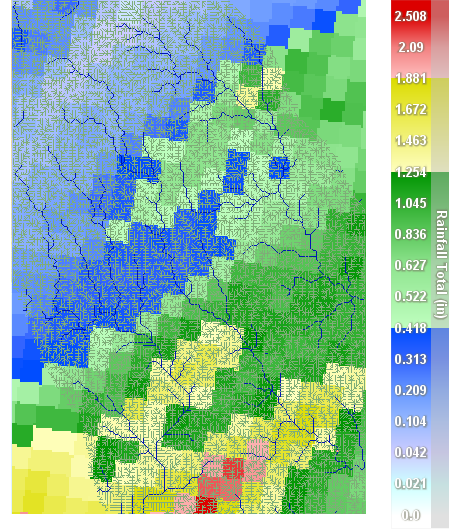
 tool of the Vflo™ Toolbar may also be used to open the Rainfall Wizard.) In the Rainfall Wizard dialog, choose the Existing RRP File option, then click Browse. Locate Tutorial4\Event_1_Rain.rrp and click Open. In the Rainfall Wizard dialog, click Next. Rainfall total values will be mapped in the Main Display, as shown below.
2. Load observed data for Event 1 at cell Blue River/CS1.
- Select cell Blue River/CS1. Open the Watch Points list (located in the Cell List pane), click on the name Blue River/CS1, then click the Zoom tool to zoom to and select the cell.
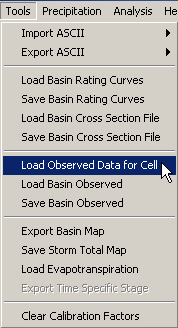
- Select Tools | Load Observed Data for Cell. Select the file located at Tutorial4\english\Event_1_Obs_english.
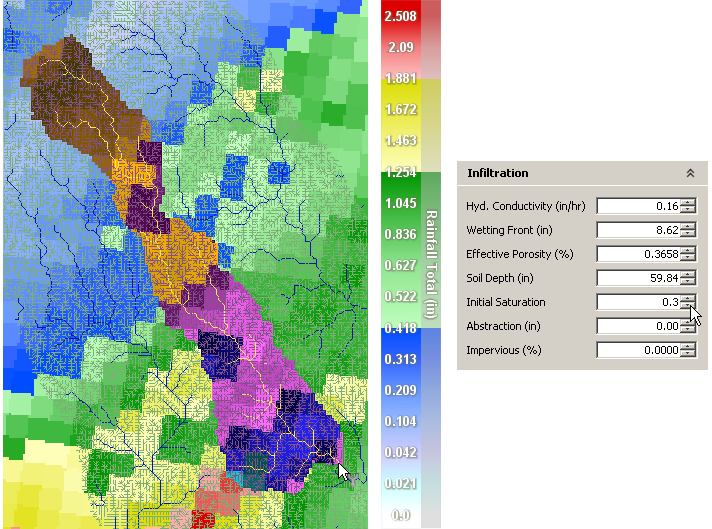
3. Before solving Vflo™, observe the infiltration parameters.
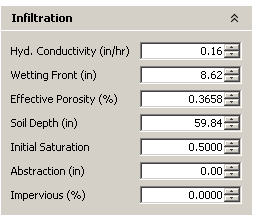
- Click on the Infiltration panel and observe the Green & Ampt infiltration parameters being used. Using the Selection
 tool, click on a few cells in the basin to observe differences between infiltration values. The only basin-wide constant is the initial saturation.
4. Solve Vflo™.
- Select the Blue River/CS1 watch point and press the shortcut key F5.
- Alternative methods: select Analysis | Analyze Cell, or click the Analyze cell
 tool located in the Vflo™ Toolbar.
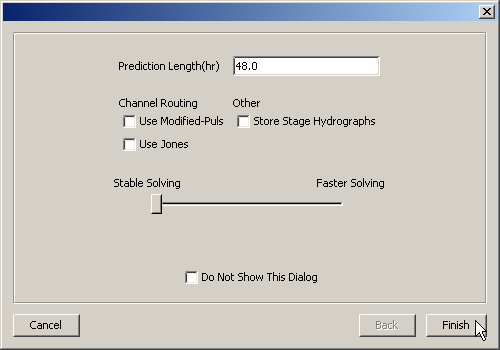
- Alternative methods: select Analysis | Analyze Cell, or click the Analyze cell
- In the Analysis Options window, enter "48.0" hours in the Prediction Length field. Ensure that all other options are un-checked.
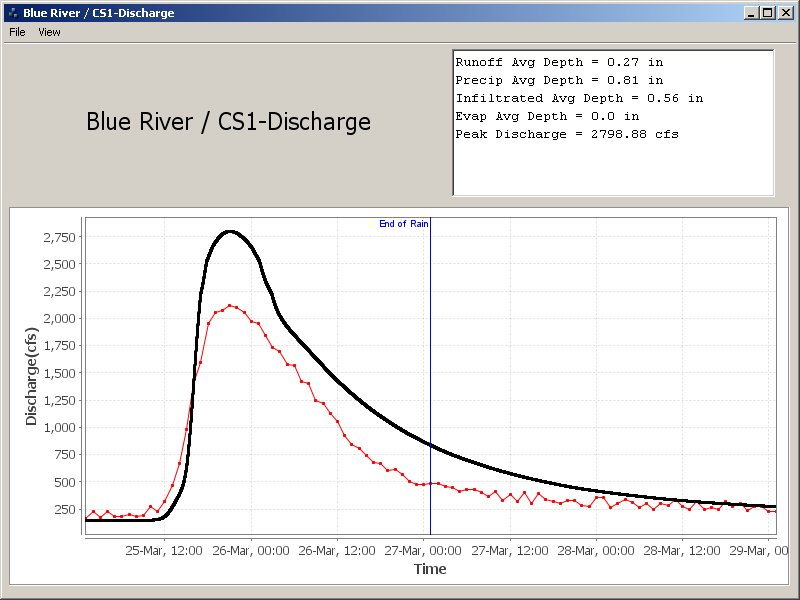
5. Analyze the generated hydrographs.
- Notice the differences in the simulated (black) and observed (red) discharge hydrographs. Perhaps the initial saturation value is too high for Event 1. Make a note of the initial saturation value used.
6. Edit infiltration values.
- Select all cells upstream of Blue River/CS1 by holding CTRL and clicking on the CS1cell within the Main Display window.
- Alternative method: click the Selection tool and the Select upstream cells
 tool from the Vflo™ Toolbar, then click on the CS1 cell within the Main Display window.
- Alternative method: click the Selection
- Open the Infiltration panel and change the Initial Saturation value to "0.3".
7. Solve Vflo™ again.
- With cell Blue River/CS1 selected, press F5, as directed in Step 4. Observe the differences between the simulated and observed hydrograph again. Which initial saturation value gave a better hydrograph fit? Should the initial saturation value be changed futher?
8. Further investigation is encouraged into the effects of initial saturation and other infiltration parameters on simulated hydrographs.
- Use the two rainfall events provided to learn more about editing and calibrating infiltration parameters in Vflo™. For further information about initial saturation, infiltration parameters, and calibration, see Infiltration parameters and Overview: Calibration. It is recommended that a copy of the original Blue River BOP file be saved as a backup in the event that altering parameters renders the Blue River BOP file unusable.
- Also note that various routing options may be chosen (e.g. Modified Puls) when solving the basin. Experimenting with these routing options is encouraged; keep note of how using different routing options affects the simulated hydrographs. For detailed information on routing and other analysis options, see the list of references.
Tutorial discussion
Channel cross-section information has a large influence on prediction accuracy. The Blue River basin is long and narrow, and so runoff routing plays an especially important role for this model.
In the course of model development, channel locations are determined by using AutoBOP or GIS software to process a digital elevation model (DEM) and channel shapefile(s). Subsequently, channel width and channel side slope values are populated for channel cells by importing ASCII parameter maps or using the Cell Properties module to edit values. As with all channels in Vflo™, trapezoidal cross-sections (channel width and channel side slope values) may be assumed based on local knowledge of the basin and channels, geomorphic relationships between drainage area and channel width, or other methods.
Where rating curves (stage-area and stage-discharge curves) or cross section data (measured pairs of distance and elevation) are available for a channel cell, the cell should be changed to a rated channel cell or cross section cell, respectively. Incorporating measured cross sections into model simulations generally improves results, depending on channel variations between cross sections. The Blue River is a rural undeveloped area with no channel modifications, and so channel variation between rated channel cells (watch points CS1 through CS14, in this tutorial) is not great. This is in contrast to urban basins, where channels are often modified (lined with concrete, for example). In urban basins, the cross-sectional dimensions and roughness values of modified channels are often well documented, easing model development.