Changing the Vflo™ Display
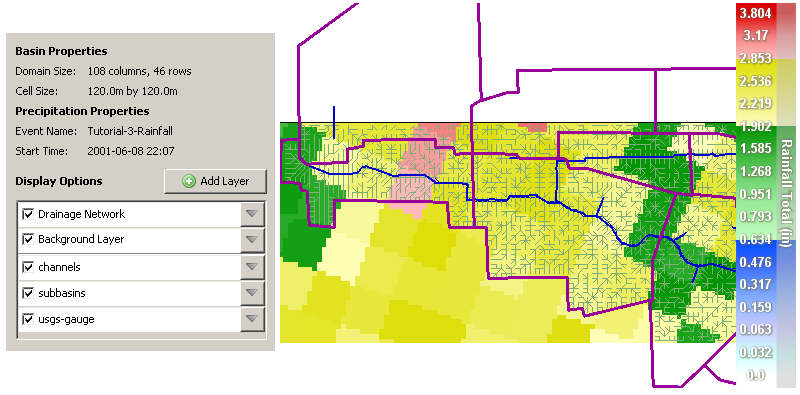
Located in the center of the Vflo™ interface (and shown below on the right), the Vflo™ Main Display illustrates the model grid, cell connections, background image, rainfall maps, color-graded parameter maps, and any shapefiles that have been loaded to the Vflo™ model. The Display Options pane, located on the upper left side of the Vflo™ interface (and shown below on the left) allows user control of the Main Display. The instructions below describe how the Display Options pane can be used to load shapefiles and background images, to toggle layers on and off, and to modify shapefile properties to obtain an optimal model display.
Displaying the drainage network
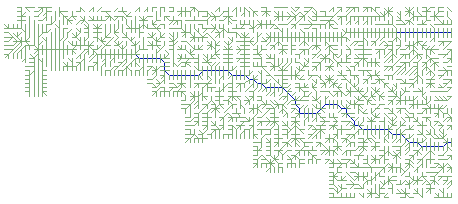
A model's drainage network is made up of flow direction arrows that specify runoff routing. The drainage network model for Brays Bayou, TX is shown below. Follow the step-by-step instructions below to toggle the Drainage Network layer on and off. To edit the flow direction of a specific cell, use the Draw cell connections ![]() tool or the Selected Cell panel, as described in Editing flow direction. For instructions on exporting a flow direction map, see Exporting parameter maps.
tool or the Selected Cell panel, as described in Editing flow direction. For instructions on exporting a flow direction map, see Exporting parameter maps.
Step-by-step instructions
1. Display the drainage network.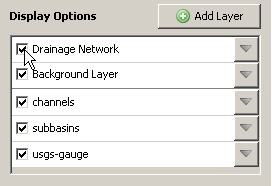
- Toggle the Drainage Network on by checking the Drainage Network box, as shown at right.
2. Hide the drainage network.
- To toggle the Drainage Network off, uncheck the Drainage Network box.
Displaying grid cells
Displaying the basin grid may be useful for identifying individual cells and providing spatial reference. The grid may be toggled on and off for user convenience. In addition, the Auto Grid option hides the grid until the Main Display is zoomed in to a certain extent.
Step-by-step instructions
1. Turn on Auto Grid.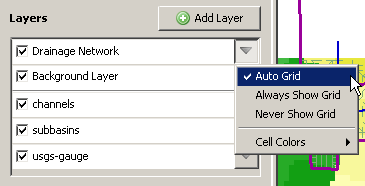
- Open the Drainage Network drop down menu and select Auto Grid, as shown at right. The drop down menu is opened by clicking on the Drainage Network
 tab.
tab.
2. Display the grid outline.
- Open the Drainage Network drop down menu, and select Always Show Grid.
3. Hide the grid outline.
- Open the Drainage Network drop down menu, and select Never Show Grid.
Changing cell colors
A cell's color is the color of its flow direction arrow. To distinguish different cell types in the Main Display, change cell colors using the Drainage Network drop down menu.
Step-by-step instructions
1. Select Cell Colors from the Drainage Networkdrop down menu.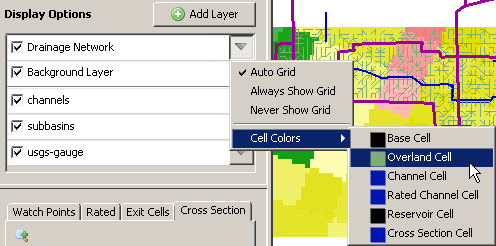
- Open the Drainage Network drop down menu by clicking on the Drainage Network tab . Then select Cell Colors | Overland Cell (or Cell Colors | Channel Cell, etc.), as shown at right.
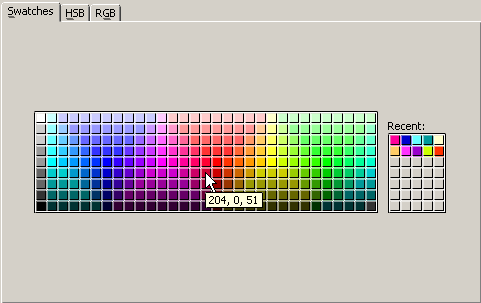
- The Choose Cell Color window features 3 different methods for controlling cell color.
- The Swatches tab, shown at right, allows the user to select a cell color from a variety of color swatches.
-
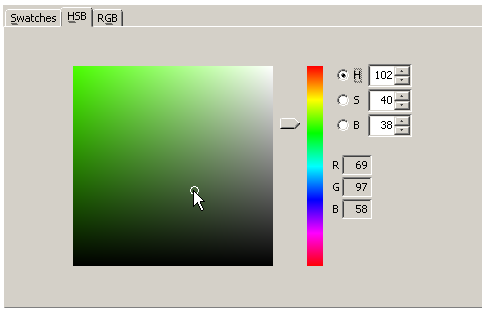
The HSB tab allows the user to control Hue, Saturation, and Brightness, as shown at right.
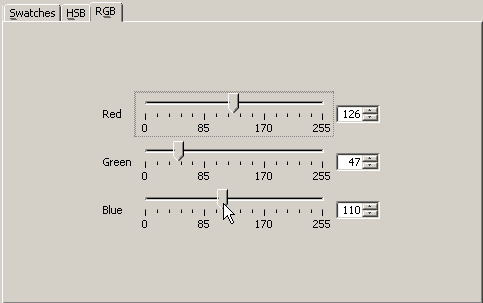
-
The RGB tab allows the user to control the intensity of the Red, Green, and Blue components of the cell color, as shown at right.
Choosing the background layer of the Main Display
The background layer is the main map shown in the Main Display. Below, a roughness map has been selected as the background layer. The background layer may be any of the following:
- Rainfall map
- Rainfall map overlaid on a background image
- Parameter map
- Roughness map
- Slope map
- Hydraulic conductivity map
- Wetting front map
- Effective porosity map
- Soil depth map
- Initial saturation map
- Abstraction map
- Impervious map
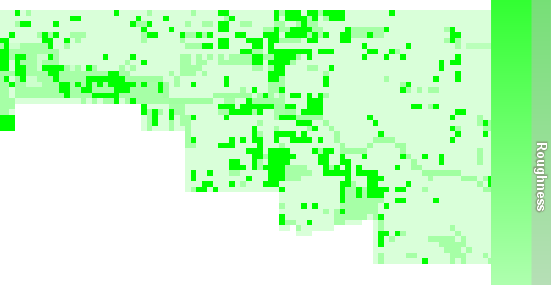
When a rainfall map or parameter map is displayed, a color grade scale will appear on the right side of the Main Display.
Step-by-step instructions
1. To change the Background Layer featured in the Main Display, open the Background Layerdrop down menu.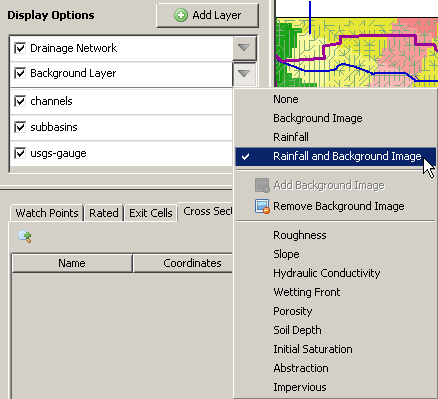
- Click the Background Layer tab , then choose the desired map from the list.
2. To toggle the Background Layer off, uncheck the Background Layer box or select None from the Background Layer drop down menu.
Background maps and images
Adding a background map or image can be helpful in locating points of reference, acting as a guide for editing flow directions, and improving the appearance of the Vflo™ display. Background options include shaded relief images, aerial photos, and satellite imagery. The following file types are accepted: JPEG (*.jpg), PNG (*.png), or GIF (*.gif). High resolution images are preferable. To be viewed in the proper geographic context, a world file is necessary to geo-reference the map image. The world file must reside in the same directory as the background image file. If a world file is not available, then the user may choose to stretch the image to the Vflo™ domain.
Loading a background image
Step-by-step instructions
1. Click the Background Layer tab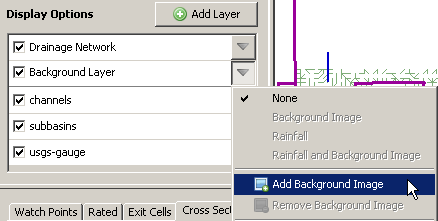
2. In the Choose background image dialog, navigate to the desired image and select Open.
- JPEG (*.jpg, *.jpeg), GIF (*.gif), and PNG (*.png) files are accepted.
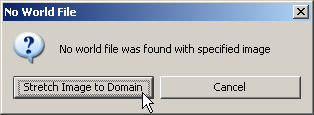
- If a world file is not present, the notification shown at right will appear. Choose Stretch Image to Domain, or select Cancel.
Discarding a background image
Step-by-step instructions
1. To remove a background image, click the Background Layer tab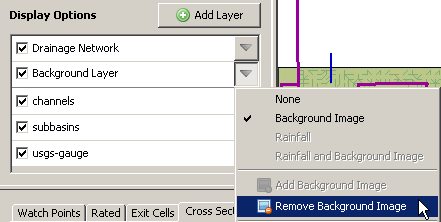
Toggling a background image on and off
Step-by-step instructions
1. Toggle the Background Layer on.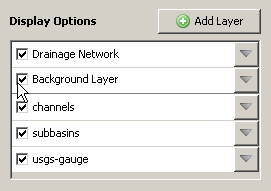
- Check the Background Layer box, as shown at right.
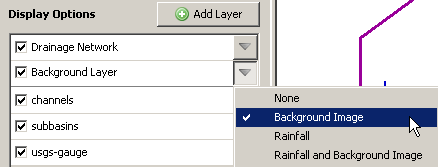
- As can be seen by opening the Background Layer drop down menu, the Background Layer may not necessarily be the background image. A Rainfall map or a parameter map may serve as the Background Layer, instead. To display the background image as the Background Layer, select Background Image from the Background Layer drop down menu, as shown at right.
- To display the background image and the rainfall map simultaneously, select Rainfall and Background Image from the Background Layer drop down menu.
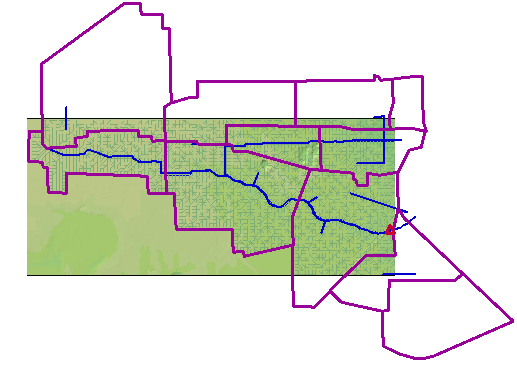
Shapefiles
Shapefiles indicating the location of channels, basin boundaries, sub-basins, rain gauges, stream gauges, roads, etc. may be useful for display. To be positioned and displayed appropriately, shapefiles must either be accompanied by a projection file (PRJ, *.prj), or must be in the same projection as the parameter maps used to develop the Vflo™ model. (Shapefiles loaded using AutoBOP do not have to meet these requirements, see AutoBOP for details.) Once loaded, shapefiles are saved within the BOP file. It's not required to clip shapefiles to the Vflo™ domain, but doing so may save BOP file loading time. In the Brays Bayou, TX model shown below, three shapefiles have been loaded to mark channels (blue line), sub-basins (purple line), and USGS gauge sites (red triangle emblem). See below for instructions on loading shapefiles and customizing shapefile display.
Step-by-step instructions for loading shapefiles
In AutoBOP:
- See here for information on loading shapefiles in AutoBOP.
Using the Display Options pane:
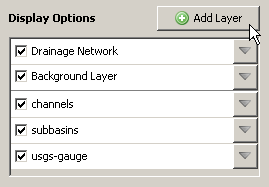
1. Click the  Add Layer button.
2. Navigate to the desired shapefile, then click Open.
- If the shapefile directory contains a PRJ file (*.prj) to provide coordinate system information, then the shapefile will load automatically. The PRJ file must have the same name as the shapefile. For example, a shapefile brays.shp would need to be accompanied by a PRJ file brays.prj. If no PRJ file is located, then the error message shown at right will appear. Click either Assume same coordinate system, or Cancel.
Step-by-step instructions for customizing shapefile display
1. Toggle the shapefile layer on.
- Once a shapefile is loaded, it will appear in the Display Options list. To show the shapefile in the Main Display, make sure that the checkbox next to the shapefile name is checked. To toggle the shapefile off, uncheck the checkbox.
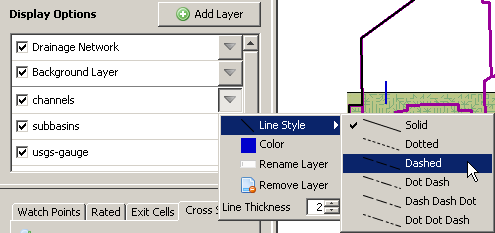
- To open the shapefile drop down menu, click the shapefile tab . Select Line style from the drop down menu. Then, select the desired line style from the secondary drop down menu.
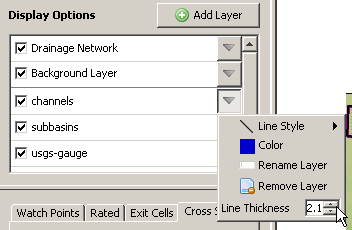
- Click the shapefile tab . Use the Up and Down arrows beside the Line Thickness field to increase or decrease the thickness of the shapefile line.
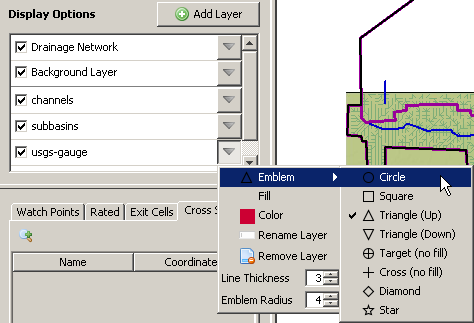
- To select the emblem marking each point in the shapefile, click the shapefile tab , hold the mouse over Emblem in the drop down menu, then select the desired emblem from the drop down list of options.
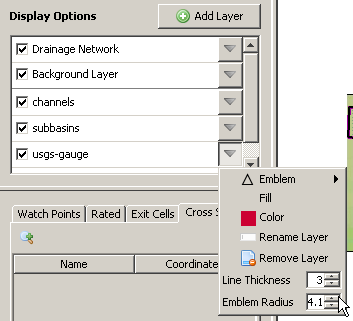
- Click the shapefile tab . Use the Up and Down arrows beside the Emblem Radius field to increase or decrease the size of the emblem.
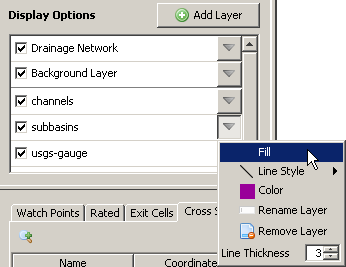
- To fill polygon or emblem shapes, click the shapefile tab , then select Fill from the drop down menu. The fill color will be that selected for the shapefile Color (the same color is used for the shapefile line and fill).
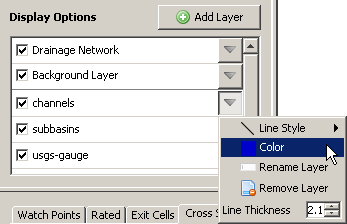
- Open the shapefile drop down menu by clicking the shapefile tab . Select Color from the drop down menu. In the pop up dialog, choose a new shapefile color using the Swatches, HSB, and RGB tabs. See above for details regarding the Swatches, HSB, and RGB color choice options.
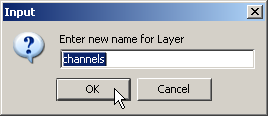
- Click the shapefile tab , then select Rename Layer from the drop down menu. In the Input dialog, type in the new shapefile name, then press OK. The new name will identify the shapefile in the Display Options list.